
Growth Stock Valuation Metrics Every Investor Should Know
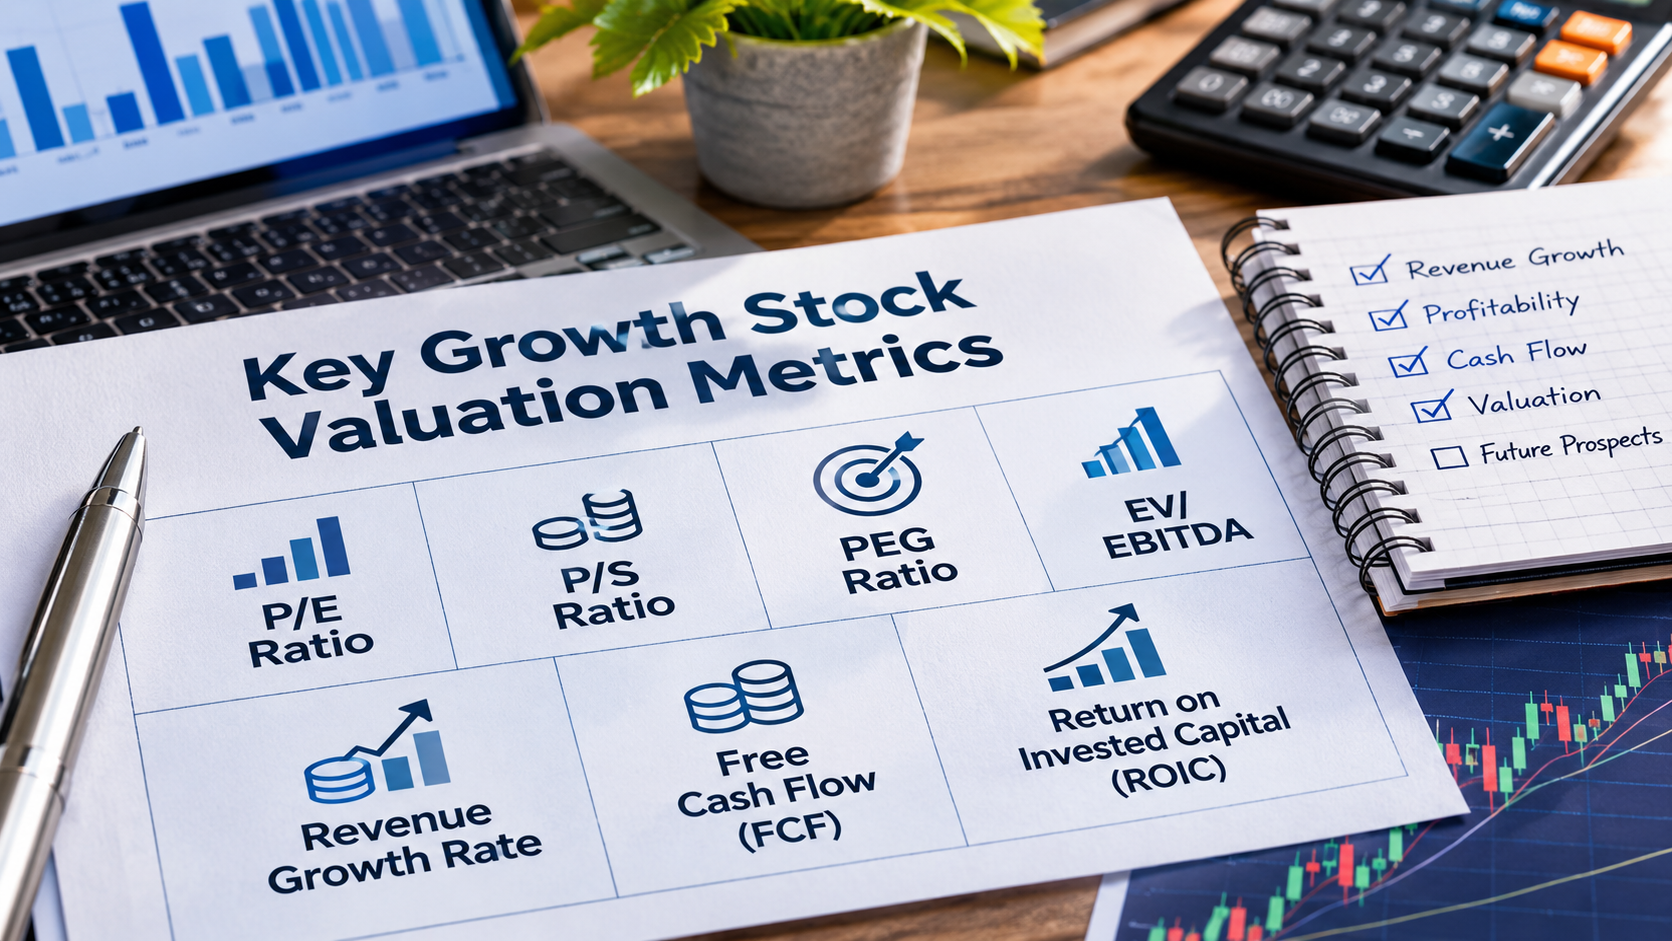
Growth stocks can provide investors the opportunity to invest in companies with great potential for growth, innovative products and growing market demand. But judging these companies isn’t just a matter of looking at revenue growth or share price performance. Many growth-oriented companies that reinvest heavily in the business may not be best measured by traditional valuation metrics. Key growth stock valuation metrics can help investors gauge whether a company’s market price is justified based on its financial performance, future prospects and overall business strength.
1. Price-to-Earnings (P/E) Ratio
Price-to-Earnings Ratio measures a company’s share price compared to its earnings per share (EPS). It helps investors understand how much the market is prepared to pay for a dollar of earnings.
Formula:
P/E Ratio = Share Price / Earnings Per Share
Growth stocks typically carry higher P/E ratios, since investors anticipate earnings to expand over time. But a high multiple does not necessarily mean good value. Investors should compare the ratio to industry peers, historical levels, and the company's predicted profits growth.
For companies that aren’t yet profitable, the P/E ratio may not be significant, and alternative valuation measures may be more useful.
2. Price-to-Sales (P/S) Ratio
The price-to-sales is a measure of the company's market worth relative to its annual sales. This is especially relevant when evaluating growth enterprises that are ramping up their sales but have not yet reached consistent levels of profitability.
Formula:
P/S Ratio = Market Capitalisation / Annual Revenue
A lower P/S ratio may mean investors are paying less for every dollar of sales, but that doesn’t guarantee the company is undervalued. Also look at revenue quality, gross margins, customer retention and the company’s route to profitability.
3. PEG Ratio
The price/earnings-to-growth (PEG) ratio is a variant of the P/E ratio that considers predicted earnings growth. This might assist investors judge if the company is fairly valued relative to its expected profits growth.
Formula:
PEG Ratio = P/E Ratio / Annual EPS Growth Rate
The PEG ratio is frequently considered a helpful yardstick when it reaches about 1, and a greater score could indicate that the share price is reflecting significant expectations of future growth. But the computation relies on expectations of earnings that can alter and may not occur.
4. Enterprise Value to EBITDA (EV/EBITDA)
EV/EBITDA is of corporate enterprise value against its profits before interest, taxes, depreciation and amortisation. Enterprise value includes stock value and net debt and gives a more complete perspective of a company’s valuation than market capitalisation alone.
Formula:
EV/EBITDA = Enterprise Value/EBITDA
It is useful for comparing businesses with different capital structures and financing arrangements. Lower multiples may suggest a more reasonable valuation, but investors should also evaluate variations in growth rates, operational margins and capital needs.
5. Revenue Growth Rate
Revenue growth is at which a company’s sales are growing, over a period of time. This is a key metric for a growing organisation, especially one that is spending in expanding its market, launching new goods or acquiring customers.
Formula:
Revenue growth rate = [(Current revenue – Previous revenue) / Previous revenue] x 100
The steady growth of revenue is a clear sign of growing demand and effective business growth. But investors need to dig deeper than acquisitions or a temporary market environment and ask whether the expansion is supported by recurrent revenues, sustainable client demand, and improving business fundamentals.
6. Free Cash Flow (FCF)
Free cash flow the cash left after a corporation pays for its capital expenditure. It offers insight into how well a company can finance its operations, invest in growth, and pay its financial responsibilities without relying too much on external financing.
Formula:
Free Cash Flow = Operating Cash Flow – Capital Expenditure
Negative free cash flow can occur in growth companies that are investing in technology, infrastructure or market expansion. This is not necessarily a sign of weakness, but investors should look at how efficiently the company is using its cash and if its growth strategy can be expected to generate sustainable cash flow in the future.
7. Return on Invested Capital (ROIC)
ROIC is of how well a corporation makes operating profits from the capital that it has invested in its business. This allows investors to see if management is using financial resources efficiently as the company grows.
Formula:
ROIC = Net Operating Profit After Tax / Invested Capital x 100
A steadily growing ROIC can be a sign that a corporation is getting better at turning investment into returns. You can also compare ROIC against the company’s cost of capital to see if its expansion is providing economic value.
Why Investors Should Use Multiple Valuation Metrics
There’s no valuation that can tell you whether a growth stock is attractively priced. A company could have good sales growth but poor cash creation. Or it might have a high P/E ratio supported by ambitious profit estimates. By looking at various variables together, you gain a more balanced picture of its financial state and valuation.
Investors should also compare companies in the same industry, look at historical performance and assess if future growth predictions are reasonable. How to appraise a growth stock can be influenced by business quality, competitive advantages, management execution and larger market conditions.
Risk Considerations
Growth companies can involve risk because their prices are generally based on expectations of future performance. Slower sales growth, lower profits, higher operating costs or changes in market conditions can cause share prices to be sharply adjusted. Higher interest rates could also make enterprises less attractive whose estimated returns are heavily front-loaded. Investors should consequently consider pricing with financial health, cash flow, business fundamentals and their personal risk tolerance.
Disclaimer:-
General Financial Product Advice and Regulatory Framework: Pristine Gaze Pty Ltd (ABN 66 680 815 678, ACN 680 815 678) operates as Corporate Authorised Representative (CAR No. 001312049) of Alpha Securities Pty Ltd (AFSL 330757), which is licensed and regulated by the Australian Securities and Investments Commission under the Corporations Act 2001 (Cth). This report contains general financial product advice only and has been prepared without consideration of your personal objectives, financial situation, specific needs, circumstances, or investment experience. The information is not tailored to individual circumstances and may not be suitable for your particular situation. Before acting on any information contained herein, you should carefully consider its appropriateness having regard to your personal objectives, financial situation, and needs, and consider seeking personal financial advice from a qualified financial adviser who can assess your individual circumstances and provide tailored recommendations.
Investment Risks and Market Warnings: All investments carry significant risk, and different investment strategies may carry varying levels of risk exposure including total loss of invested capital. The value of investments and income derived from them can fluctuate significantly due to market conditions, economic factors, company-specific events, regulatory changes, commodity price volatility, currency fluctuations, interest rate movements, and other factors beyond our control. Securities markets are subject to market risk from general economic conditions and investor sentiment, liquidity risk affecting the ability to buy or sell securities at desired prices, credit risk from issuer default or deterioration, operational risk from inadequate internal processes, sector-specific risks including industry regulatory changes, technology obsolescence, management changes, competitive pressures, supply chain disruptions, and mining-specific risks including resource estimation uncertainty, operational hazards, environmental compliance, permitting delays, commodity price cycles, geopolitical factors affecting mining operations, and exploration risks. Small-cap and speculative mining stocks carry additional risks including limited liquidity, higher volatility, dependence on key personnel, limited operating history, uncertain cash flows, and potential failure to achieve commercial production.
Information Accuracy and Limitations: While we endeavour to ensure information accuracy and reliability, we make no representations or warranties (express or implied) regarding the accuracy, reliability, completeness, timeliness, or suitability of information provided, except where liability cannot be excluded under applicable law. This report may include information from third-party sources including company announcements, regulatory filings, research reports, market data providers, financial news services, and publicly available information, which we do not independently verify and for which we assume no responsibility. Past performance, examples, historical data, or projections are not indicative of future results, and no guarantee of future returns is provided or implied. To the maximum extent permitted by law, Pristine Gaze Pty Ltd and Alpha Securities Pty Ltd, together with their respective directors, officers, employees, representatives, and related entities, exclude all liability for any errors, omissions, inaccuracies, loss or damage (including direct, indirect, consequential, or special damages) arising from reliance on information provided, investment decisions made based on this report, market losses, opportunity costs, and technical issues or system failures.
Frequently Asked Questions
Common questions about investing and market research to help guide your decisions.