
Murray Cod Australia Limited (ASX: MCA)
Murray Cod Australia Limited
ASX: MCA
Murray Cod Australia Limited breeds, grows and markets premium Murray cod, while also developing and selling aquaculture equipment. Its products include Aquna Murray Cod, Aquna Gold Murray Cod Caviar and Hot Smoked Aquna Murray Cod. Founded in 2010, the company is headquartered in Griffith, New South Wales, where it operates its aquaculture business.
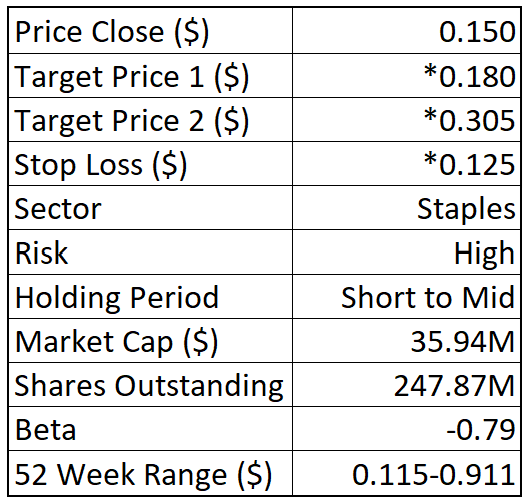
*Target Prices and Stop Loss levels are indicative reference price levels only and are provided for general informational and illustrative purposes. They are not guarantees, forecasts, or automatic triggers for action and are subject to change without notice based on market conditions, price volatility, liquidity, corporate actions, or changes in our assessment.
*If a Target Price (including Target 1 or Target 2) or Stop Loss level is reached, investors may consider reviewing their position and taking action based on their own objectives and risk tolerance.
Stock Performance Profile:
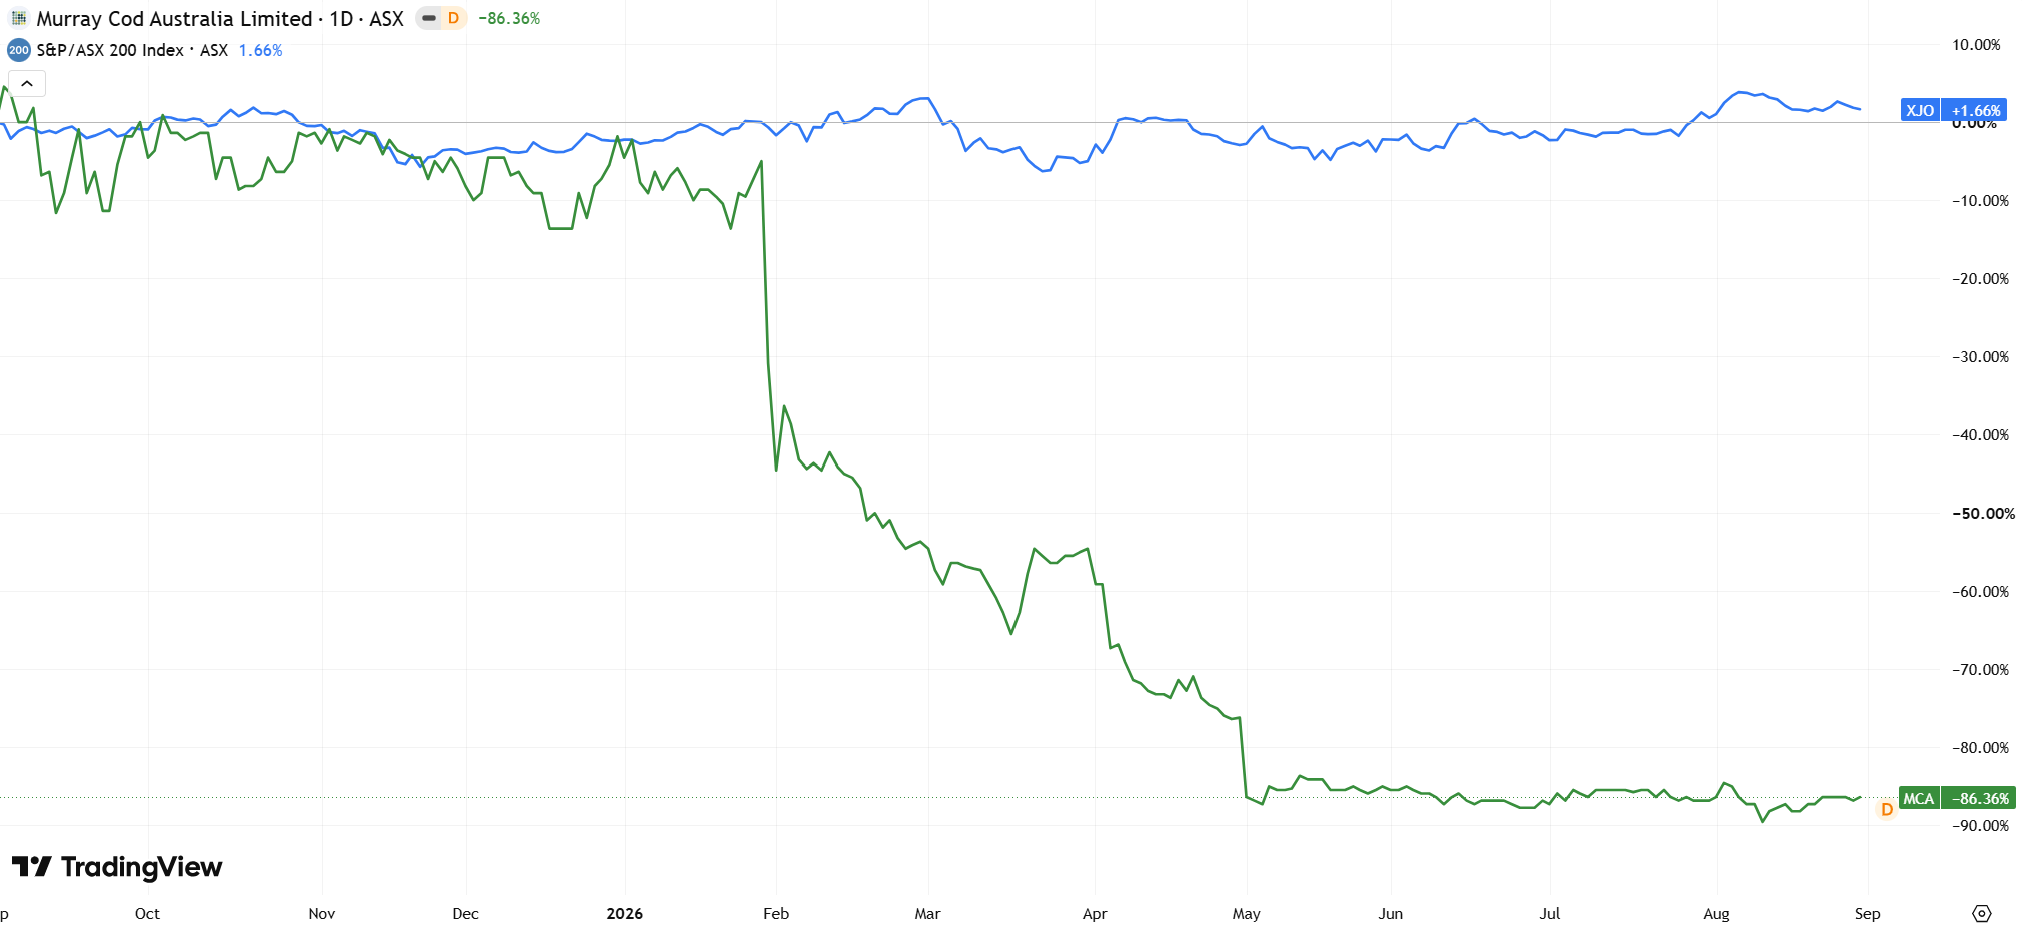 (Source: TradingView) One-Year Performance Profile of MCA on a DTF compared to S&P/ASX 200 (XJO).
From the Company Reports:
Murray Cod made solid progress in FY26, with sales volume climbing 53% to 558.4 tonnes, while customer receipts rose 17.9% to $13.38 million. Its production base is also expanding, with biomass reaching 3,784 tonnes and Q4 harvest volumes increasing 35% to 144 tonnes to meet future demand. The planned rollout across 230 Coles stores and approximately 130 Woolworths seafood departments should significantly widen retail access. At the same time, management’s productivity program reduced the workforce from 99 to 78 employees, targeting more than $1 million in annual labour savings. Operating cash outflow improved 26% to $6.45 million, while the $18.6 million entitlement offer provides additional funding to support the company’s expansion strategy.
Historical Financial Snapshot:
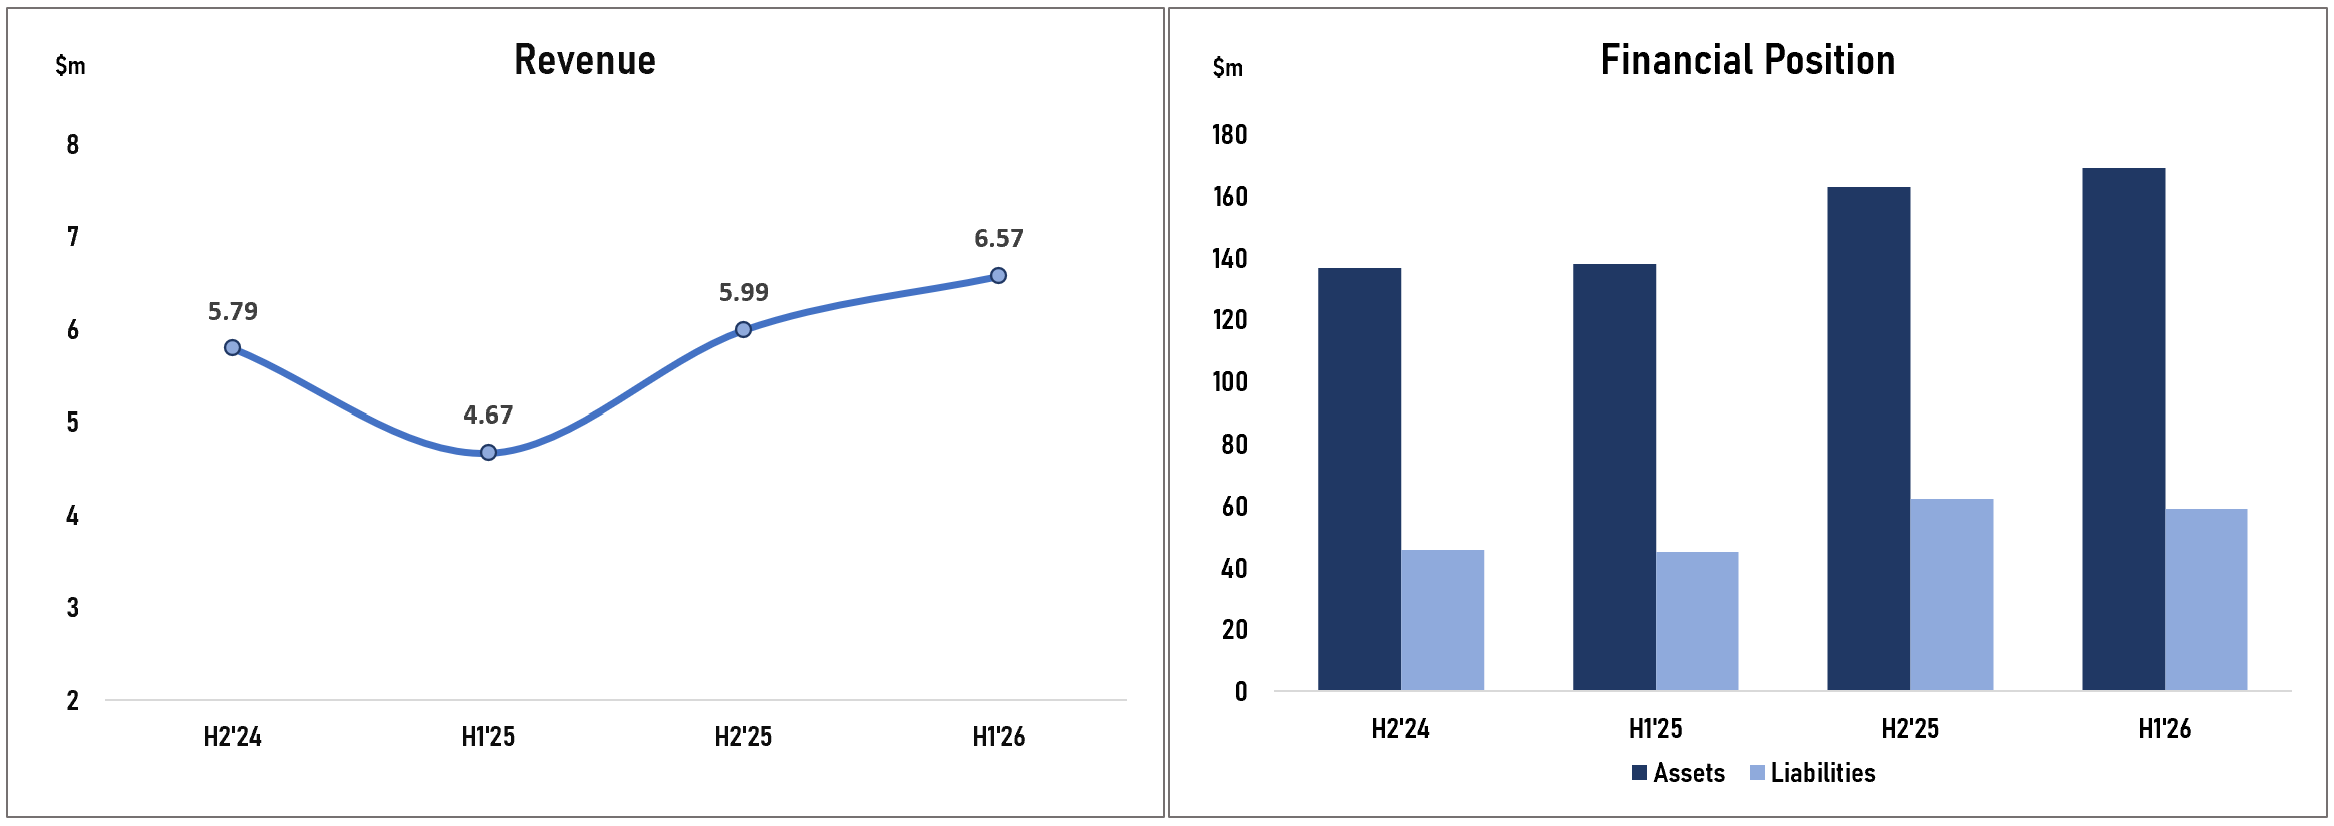
(Graphic Source: Pristine Gaze, Data Source: TradingView)
Murray Cod Australia has shown a clear improvement in its financial trajectory, with revenue recovering from $4.67 million in H1 FY25 to $6.57 million in H1 FY26, representing a 40.7% increase and the highest level across the periods presented. The momentum follows a strong H2 FY25, when revenue reached $5.99 million, indicating that the recovery is gaining consistency rather than being driven by a single period.
The balance sheet has strengthened alongside this improvement, with assets rising from $137.83 million in H1 FY25 to $169.00 million in H1 FY26, while liabilities eased from $62.12 million to $59.09 million. This combination of stronger revenue and a growing asset base, alongside lower liabilities, points to improving financial capacity as MCA continues scaling its operations.
Growth:
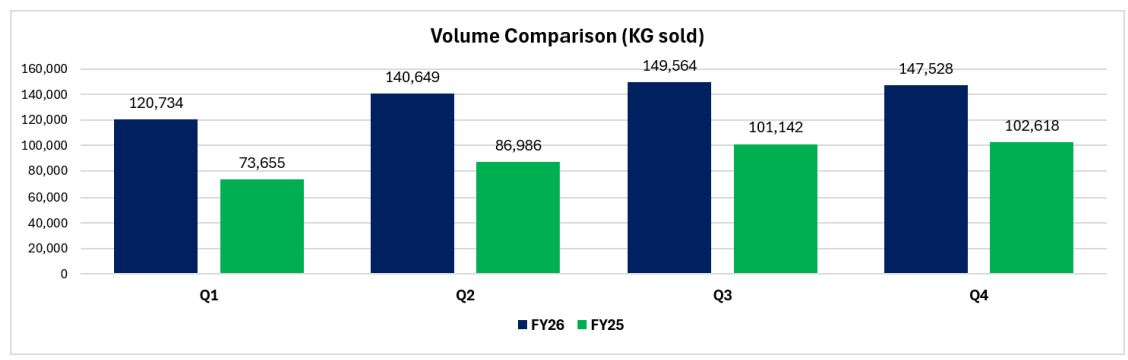
(Graphic Source: Company Reports)
MCA’s growth is increasingly being driven by stronger market access rather than simply expanding production. The transition of Stanbridge to grid power is already tracking at approximately $50,000 of monthly savings, with a potential Power Purchase Agreement offering further cost certainty. The company is also assessing feed automation with BioMar and greater harvesting and processing automation to improve yields and reduce manual handling. FY26 sales volumes remained consistently ahead of the prior year, with Q4 reaching 147.5 tonnes, up 43.8% year-on-year, following a strong 50% increase in Q3, highlighting sustained improvement in customer demand. Longer term, the Gogeldrie site provides an option for additional farming capacity, while investment in fish-protein recovery could support a broader range of value-added products.
Outlook:
MCA’s operational focus for FY27 is shifting towards creating a more scalable and efficient production model. The $1.4 million processing program includes IQF freezing, modified-atmosphere packaging and improved processing equipment, with most installations targeted by the end of Q1 FY27 and the spiral freezer scheduled for Q2 FY27. These upgrades can improve shelf life, inventory management and product flexibility while opening opportunities for additional value-added foodservice formats. Alongside this, the company’s drone-feeding trial, carrying around 100kg of feed, could provide another avenue to reduce feeding labour, wastage and farm operating costs if scaled successfully.
Risk Analysis:
MCA remains exposed to the inherent risks of aquaculture, particularly disease outbreaks, water-quality changes and adverse weather, which can affect fish survival, growth and production volumes. Rising feed and energy costs could also pressure margins, while limited freshwater availability may disrupt farming operations. Demand and pricing remain sensitive to consumer preferences and broader economic conditions.
Technical Analysis:
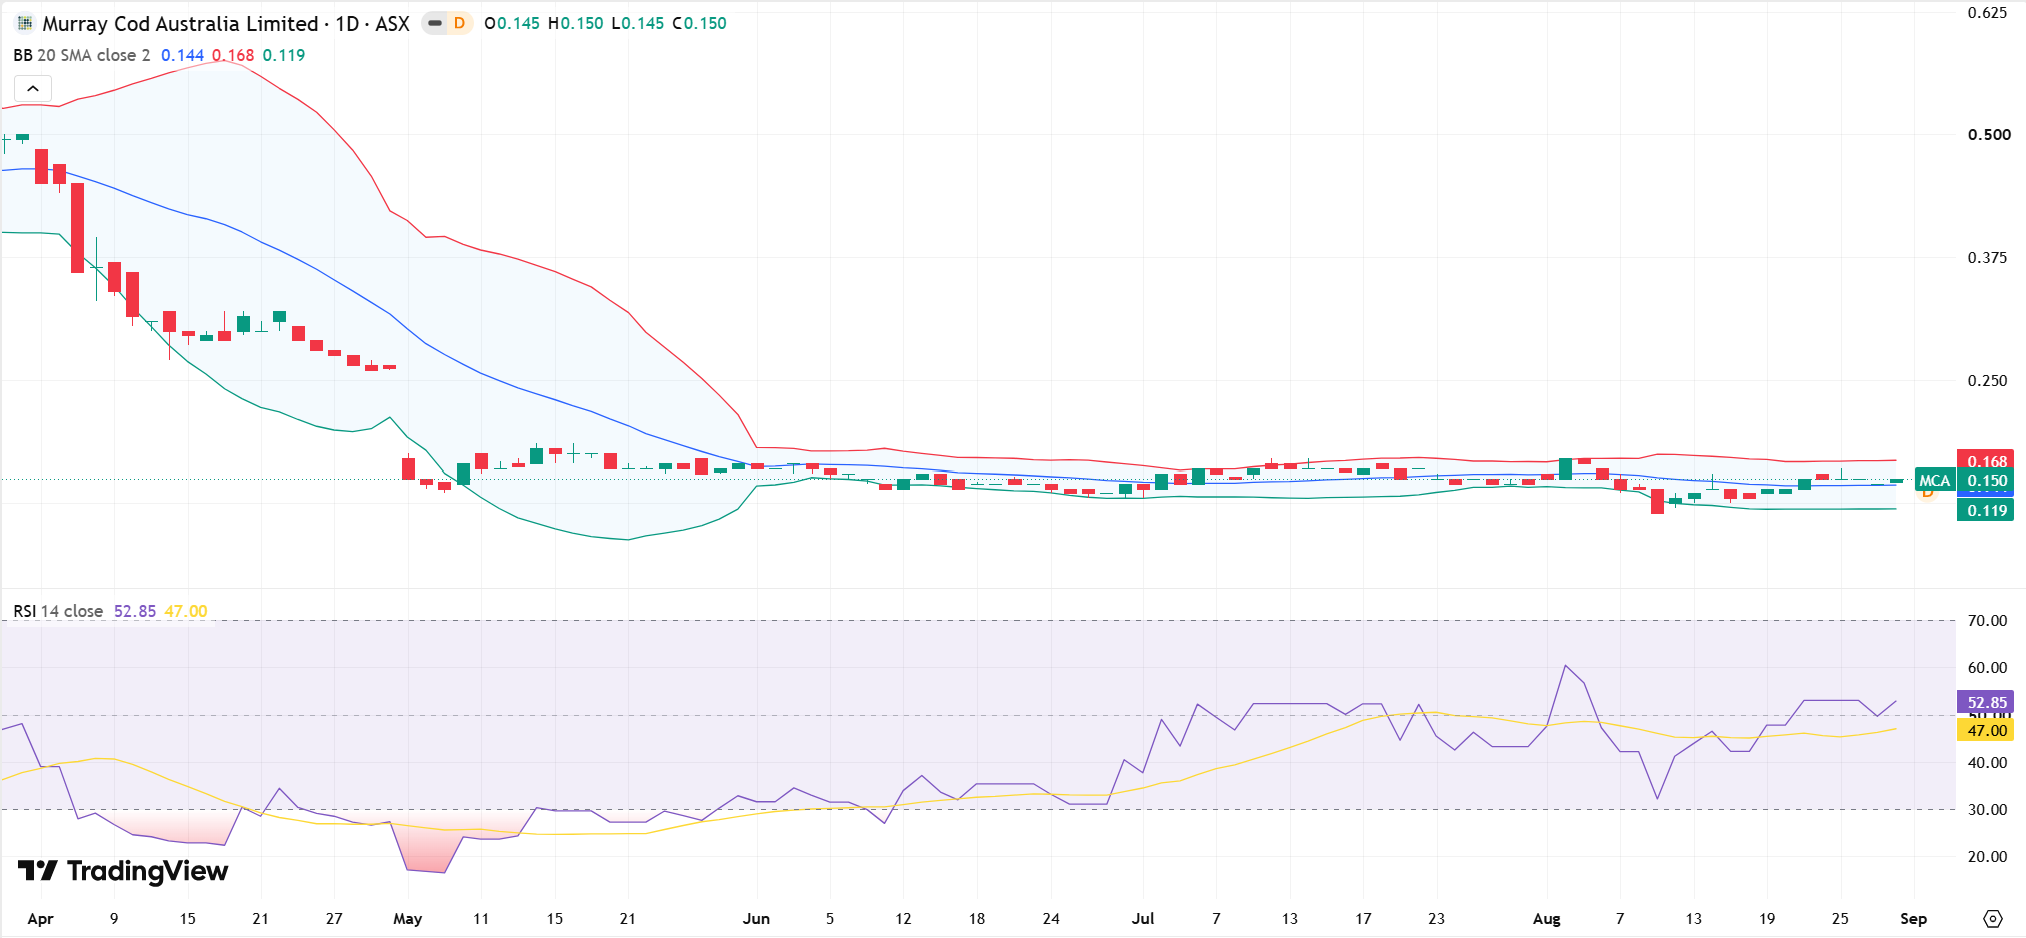
(Graphic Source: TradingView) Murray Cod Australia Limited (ASX: MCA) Daily Time-Frame (DTF) Chart.
 MCA is trading at $0.150, above its 20-day SMA of $0.144, indicating improving short-term momentum. The stock has recovered from the lower Bollinger Band at $0.119 and is now moving above the middle band, while remaining below the upper band at $0.168, leaving room for further upside. RSI at 52.85 has moved above its average of 47, signalling strengthening momentum without entering overbought territory. The recent recovery and improving RSI support a constructive technical setup, with momentum showing early signs of a sustained recovery.
Analyst’s Take:
MCA’s investment case is centred on its transition toward a more efficient, scalable and commercially diversified aquaculture business. The company is moving beyond raw fish sales by developing greater processing capability and exploring value-added products, which could improve revenue quality over time. Cost-saving initiatives across farming operations also provide scope to strengthen unit economics as production scales. Its established farming infrastructure gives MCA a platform to increase utilisation without requiring proportionate expansion in its asset base. At the same time, growing retail and foodservice exposure provides multiple channels for future market development. The key consideration is execution, particularly converting operational improvements into sustainable cash generation. If management can successfully scale its production, processing and distribution capabilities, MCA has the potential to build a more resilient earnings base.
As per Pristine Gaze, you may consider a “Buy” on “Murray Cod Australia Limited” at the closing price of “$0.150” (As of 31 August 2026).
*All currency figures are in Australian Dollars unless stated otherwise.
*All data sourced from company reports and TradingView.
Technical Analysis Defined
Resistance Levels
As the name suggests, resistance refers to a price level that restricts a stock from rising further. It represents an area on the chart where selling pressure is expected to be strong, as more investors may look to sell at these levels. Resistance levels are typically above the current market price.
Support Levels
Support refers to a price level that helps prevent a stock from falling further. It represents an area on the chart where buying interest is expected to be strong, as investors may see value at these levels. Support levels are typically below the current market price.
Bollinger Bands
Bollinger Bands are a volatility-based technical indicator consisting of three lines:
A middle band, which is usually a Simple Moving Average (SMA)
An upper band and a lower band, plotted at a specified number of standard deviations above and below the SMA
Bollinger Bands expand when market volatility increases and contract during periods of low volatility. Prices trading near the upper band may indicate overbought conditions, while prices near the lower band may indicate oversold conditions.
Simple Moving Average (SMA)
The Simple Moving Average (SMA) is calculated by taking the arithmetic average of a stock’s price over a specified number of periods. It helps smooth out short-term price fluctuations and highlights the overall trend direction. SMAs are commonly used to identify support and resistance levels, as well as trend reversals.
Exponential Moving Average (EMA)
The Exponential Moving Average (EMA) is similar to the SMA but gives greater weight to more recent prices. This makes the EMA more responsive to recent price changes. EMAs are often used for short-term trend analysis and to generate trading signals when prices cross above or below the EMA.
Relative Strength Index (RSI)
The Relative Strength Index (RSI) is a momentum oscillator that measures the speed and magnitude of recent price movements on a scale of 0 to 100. It is used to identify overbought or oversold conditions in a stock and assess the strength of a prevailing trend.
RSI Interpretation
RSI above 70: Indicates overbought conditions, suggesting the stock may be due for a pullback or correction.
RSI below 30: Indicates oversold conditions, suggesting the stock may be undervalued and could see a rebound.
RSI between 30 and 70: Generally, indicates neutral conditions, with trend strength assessed based on direction and momentum.
RSI divergences—where the indicator moves in the opposite direction of price—may also signal potential trend reversals.
Disclaimer
The reports provided by Pristine Gaze are designed to deliver general financial insights, including stock and sector market analysis and investment commentary. These reports aim to support informed decision-making but are strictly intended for informational purposes. They do not constitute personalized financial advice and should not be relied upon as such. The information provided does not take into account individual investment objectives, financial circumstances, or specific needs.
General Advice Warning: The insights and recommendations offered in Pristine Gaze reports are of a general nature and are not tailored to any individual investor’s circumstances. Investment decisions are highly personal and depend on many factors, including but not limited to financial goals, risk tolerance, and current financial standing. We strongly advise consulting a qualified financial advisor who can evaluate your unique situation and provide professional guidance tailored to your needs before acting on any information contained in these reports.
Past Performance: Historical data, including past performance metrics of securities or markets mentioned in these reports, should not be regarded as an accurate indicator of future results. The financial markets are subject to significant variability, and past success does not guarantee similar outcomes in the future. It is essential to recognize that external factors, including but not limited to economic conditions, regulatory changes, and market dynamics, can greatly influence future performance and results.
Forward-Looking Statements: Certain projections and forecasts presented in Pristine Gaze reports may include forward-looking statements based on assumptions and expectations about future market conditions. These statements are speculative and inherently uncertain, as they depend on variables that may not materialize as anticipated. Factors such as economic conditions, market trends, policy changes, and unforeseen events can significantly impact these projections. Investors should approach forward-looking statements with caution and recognize the associated risks.
Data Accuracy: All financial data, metrics, and projections contained in our reports are derived from publicly available company filings, credible industry reports, and verified sources. While Pristine Gaze endeavors to ensure the accuracy, timeliness, and reliability of the information provided, we cannot guarantee its completeness or precision. Market conditions and company policies may evolve, leading to changes in the relevance of the data presented. The content of our reports may be updated or modified without prior notice.
Technical Analysis: Reports may include discussions of technical indicators, such as Relative Strength Index (RSI), Bollinger Bands, or moving averages. These indicators are tools used to analyze market trends but are inherently speculative and subject to interpretation. They do not provide definitive predictions about future price movements and should not be relied upon as sole determinants of investment decisions. Investors should combine technical analysis with other forms of research and risk assessment.
Dividend Yield: References to dividend payments or yields are based on historical data and the current financial policies of the companies discussed. Dividends are not guaranteed and may fluctuate depending on the financial performance of the company, market conditions, and regulatory requirements. Investors should consider these variables and the potential for dividend changes when evaluating dividend-paying securities.
Liability Disclaimer: Pristine Gaze, along with its directors, employees, associates, and affiliates, assumes no responsibility or liability for any losses or damages incurred due to reliance on the information or recommendations contained in our reports. This disclaimer applies to all forms of losses, including but not limited to direct, indirect, incidental, or consequential losses. Investors are hereby advised to conduct their independent research and seek professional advice before making investment decisions.
Third-Party Data and Links: Some reports may reference external data, include hyperlinks to third-party websites, or incorporate information from other sources. While we aim to use credible and reliable references, Pristine Gaze does not endorse or take responsibility for the accuracy or reliability of external content. Users are advised to evaluate third-party information critically and acknowledge the risks of using such data.
Intellectual Property: All content within Pristine Gaze reports, including but not limited to text, graphics, designs, methodologies, and analyses, is the exclusive intellectual property of Pristine Gaze Pty Ltd. This content is protected under Australian and international copyright and trademark laws. Unauthorized reproduction, modification, or distribution of any part of the content without prior written consent from Pristine Gaze is strictly prohibited. Legal action may be pursued in the case of infringement.
Terms and Policies: For additional information regarding the terms and conditions of our services, our approach to data privacy, and the scope of our financial advice, please refer to our Terms and Conditions, Privacy Policy, and Financial Services Guide, which are available on our official website.