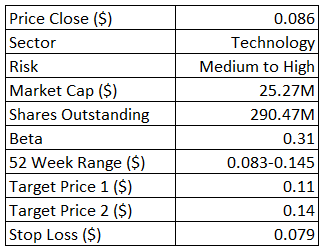
Amaero Limited (ASX:3DA)
Amaero Limited
ASX: 3DA
Amaero Ltd. engages in manufacturing of large format complex components in metal using laser-based additive manufacturing processes. The company was founded in 2013 and is headquartered in McDonald, TN.
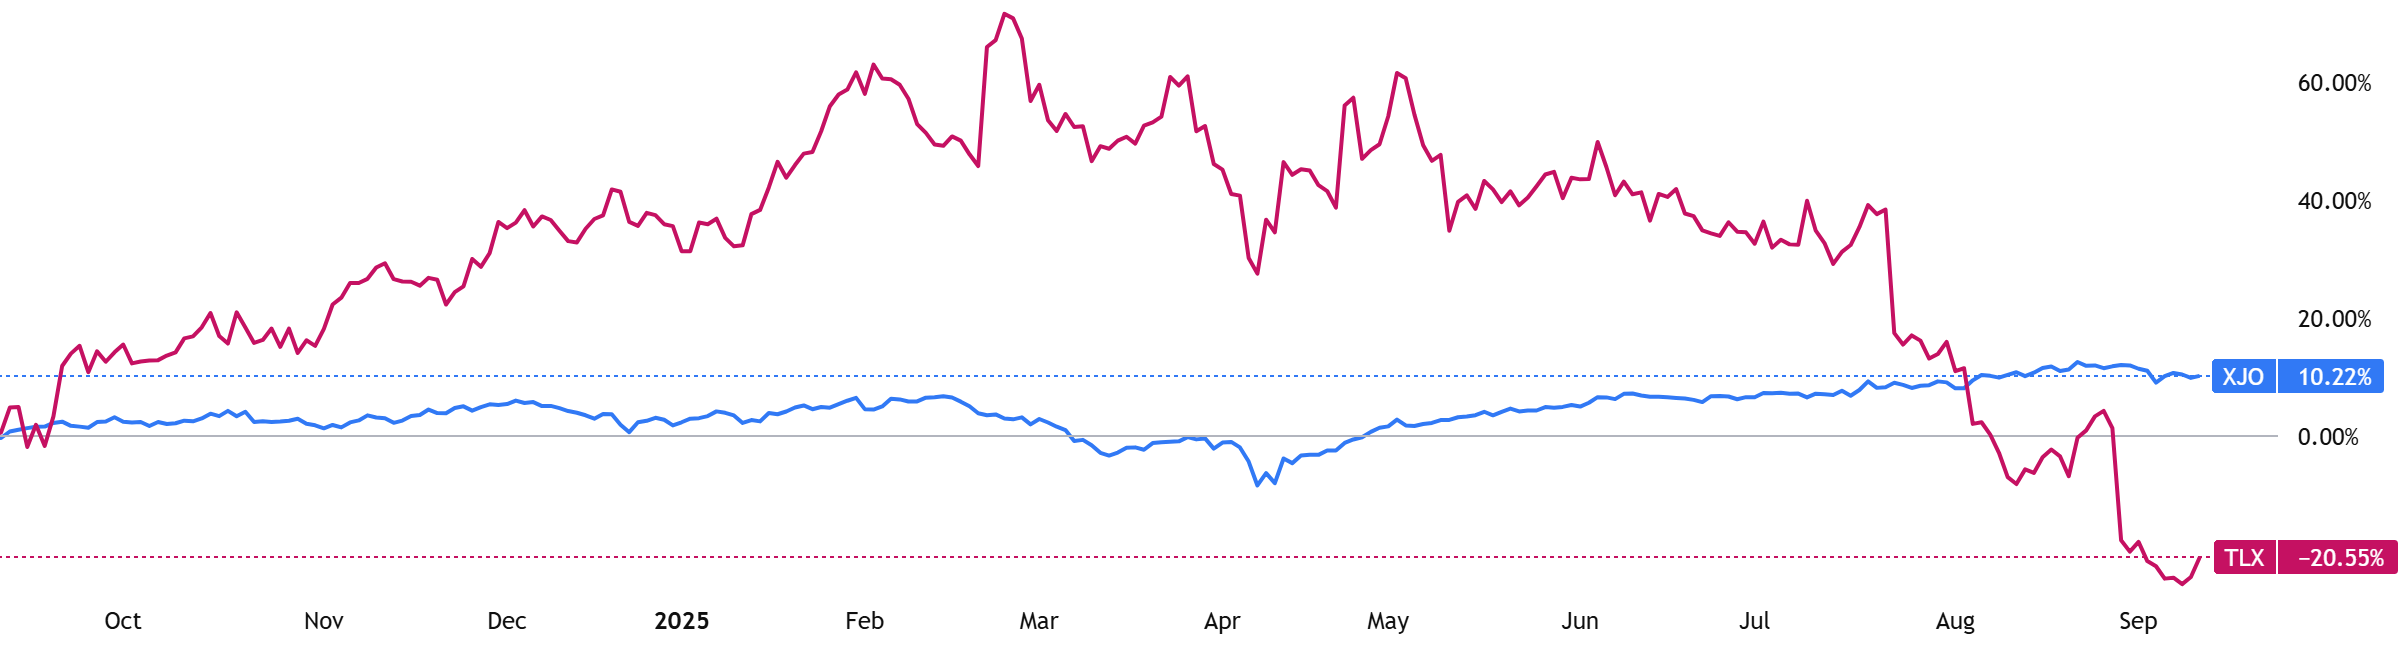
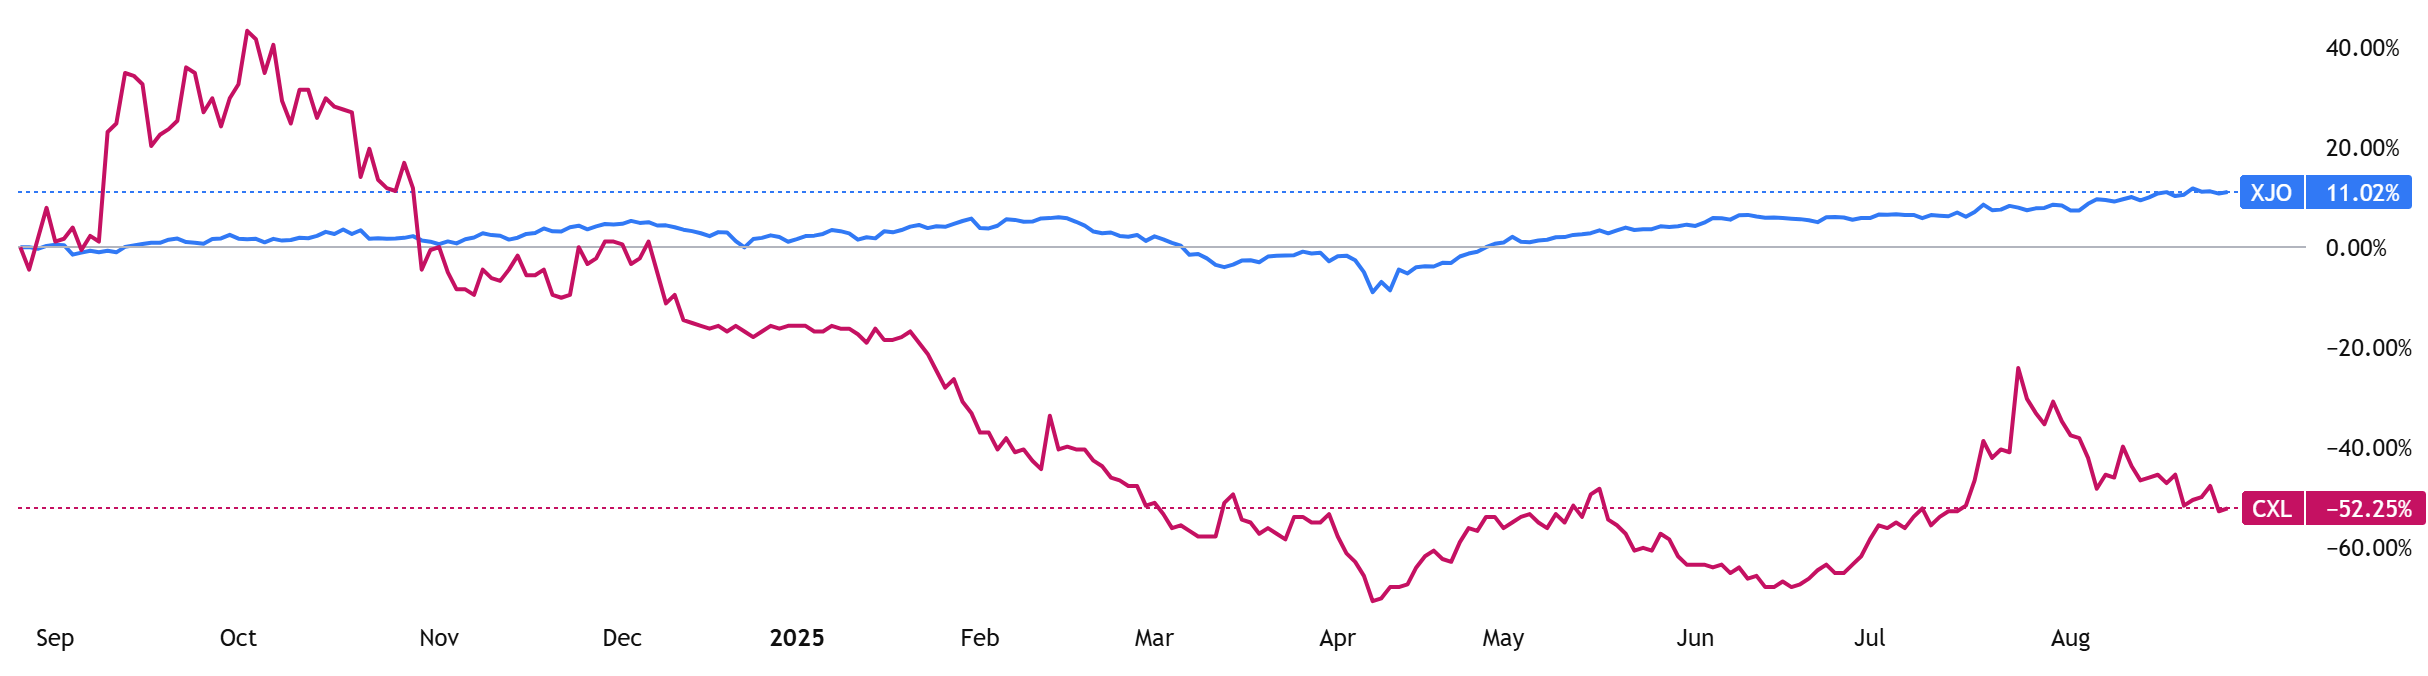
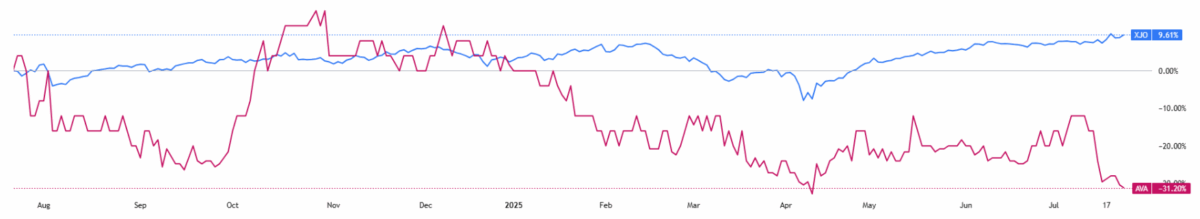
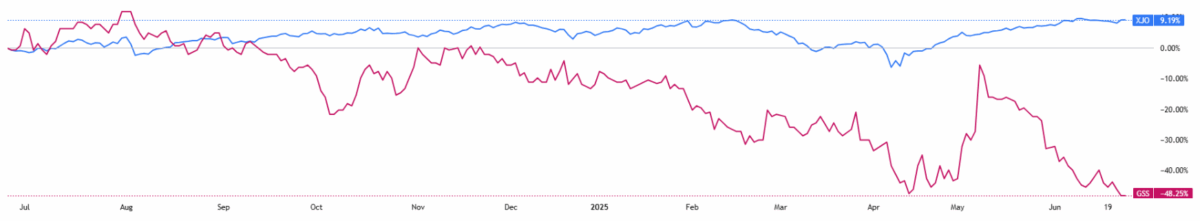
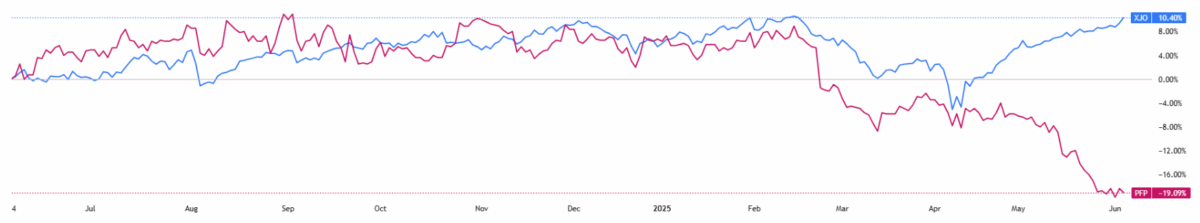
Stock Performance Profile:
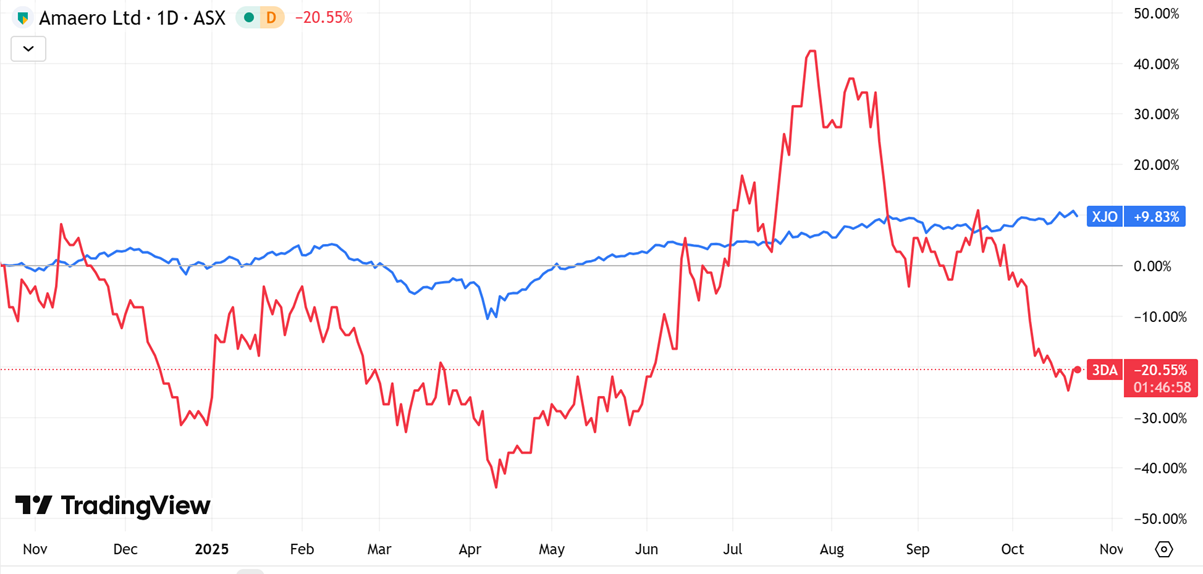
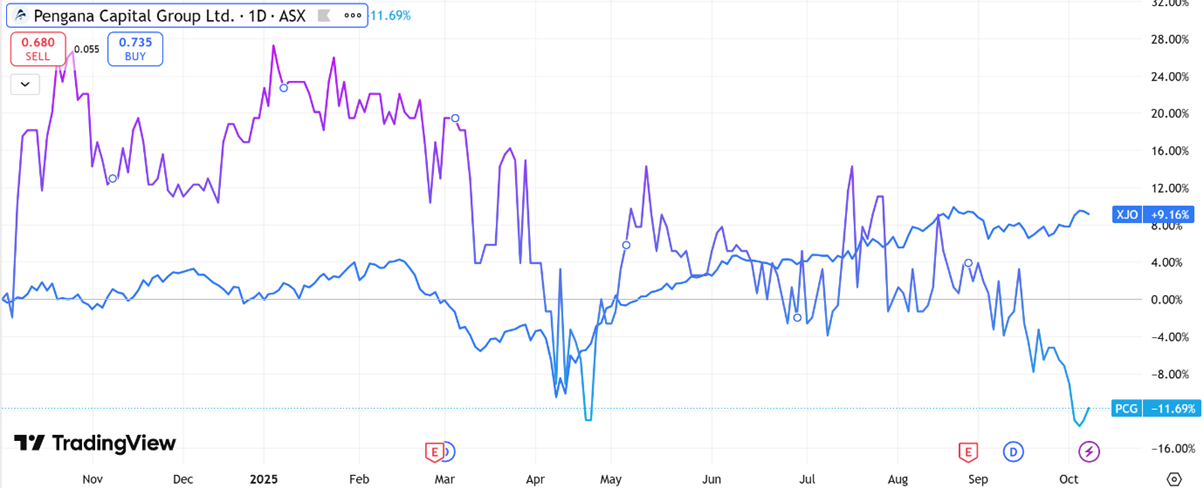
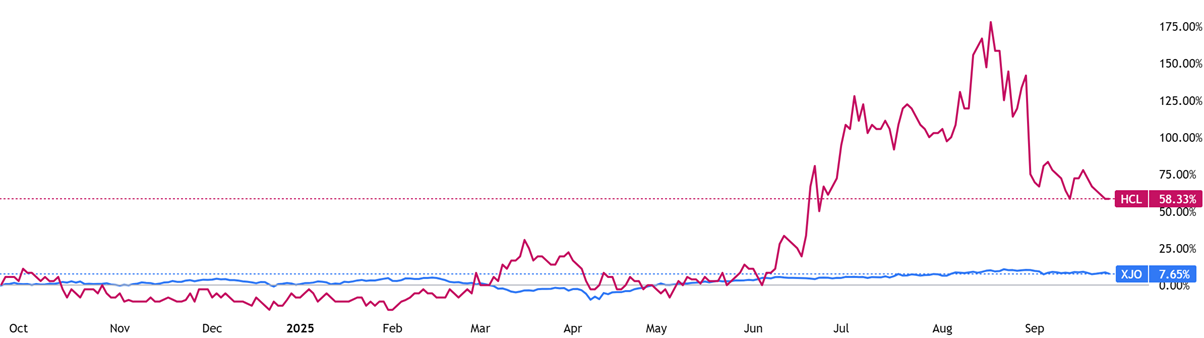
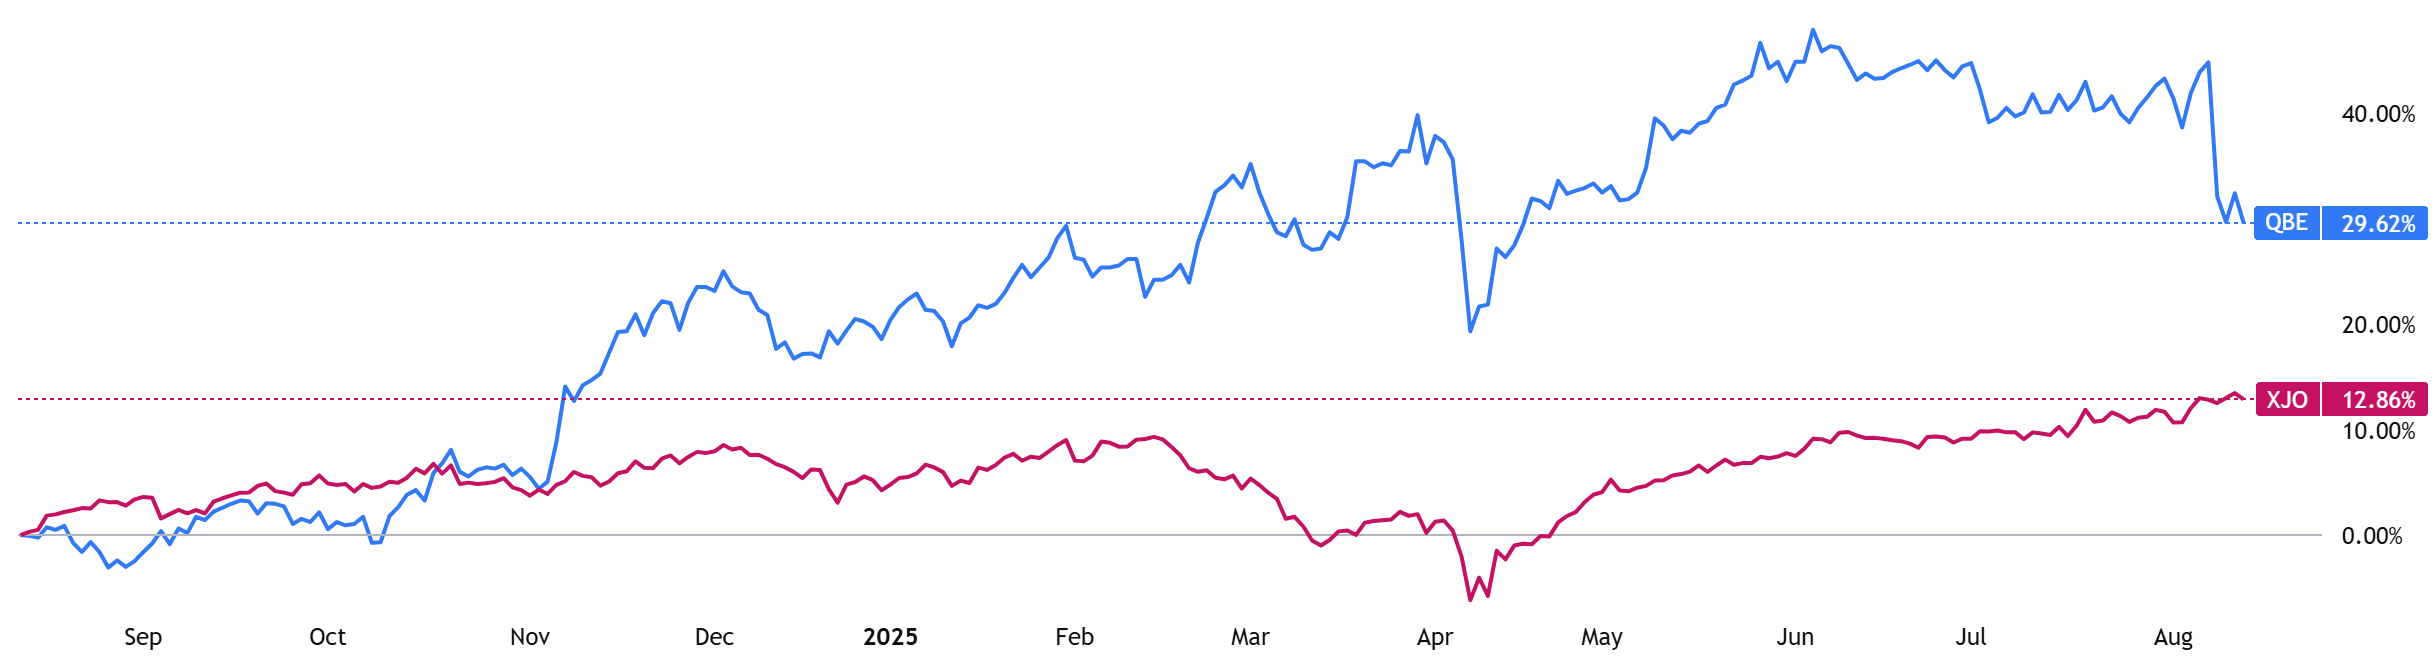
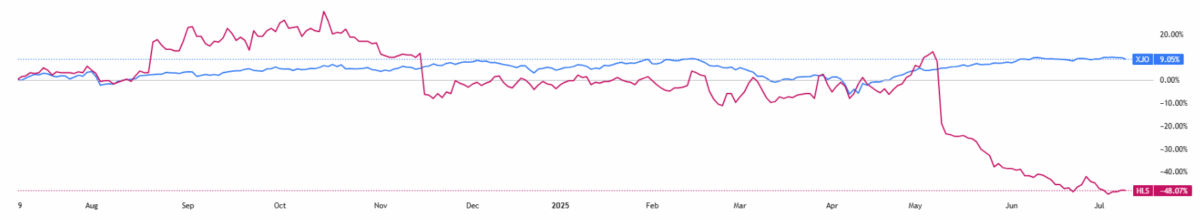
(Source: TradingView) One-Year Performance Profile of 3DA on a DTF compared to ASX200 (XJO).
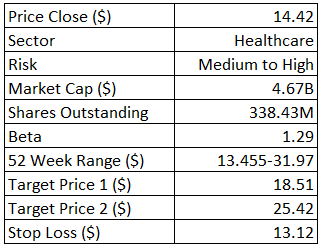
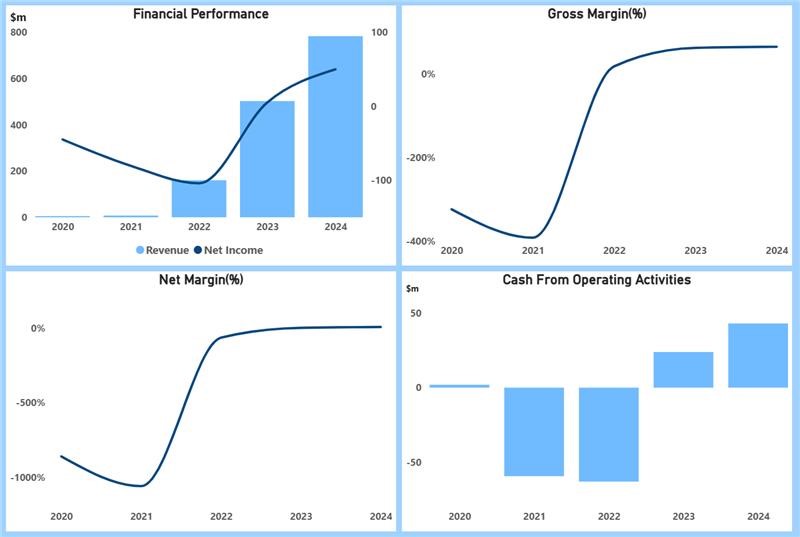
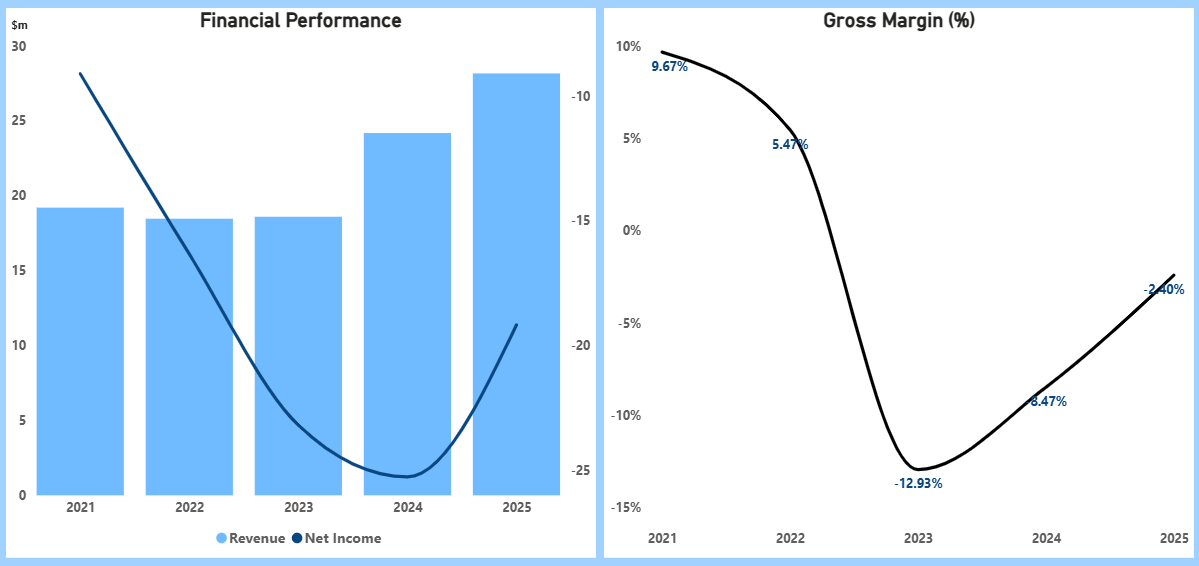
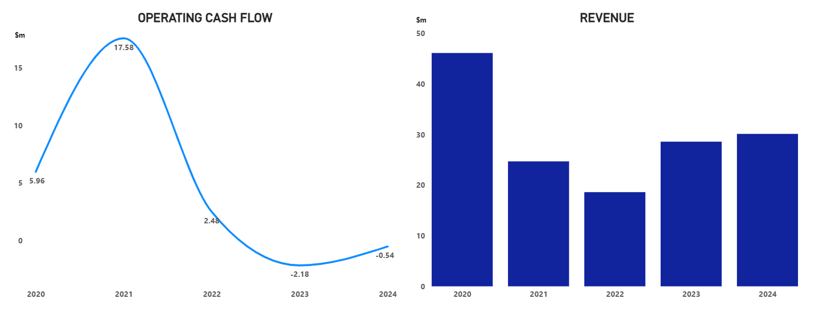
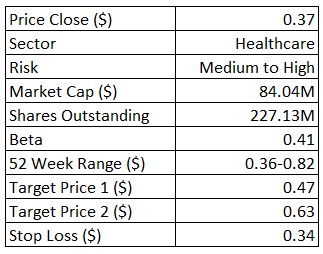
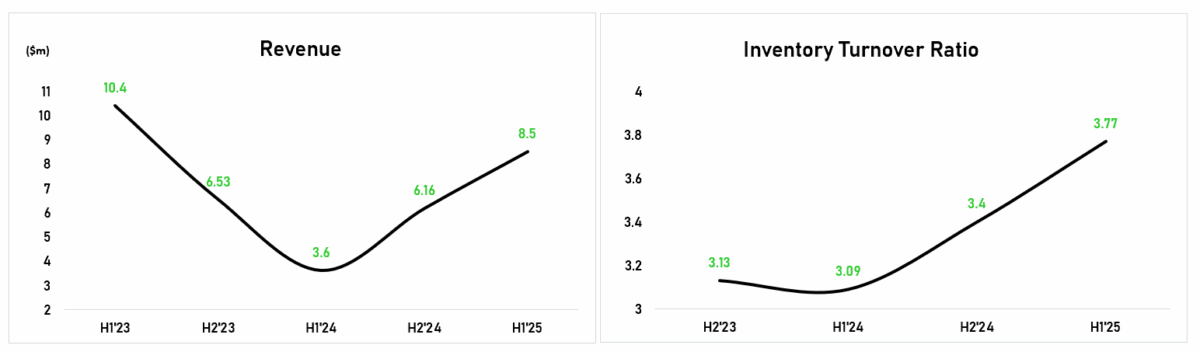
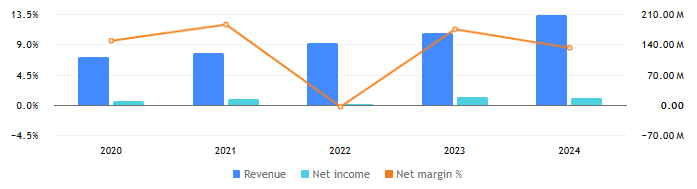
Financial Snapshot (2021-2025):
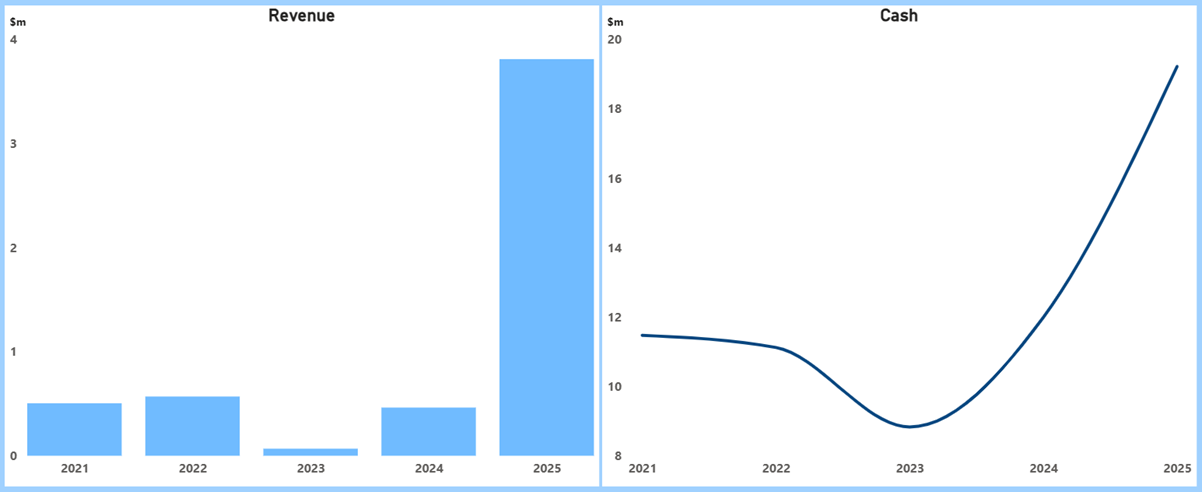
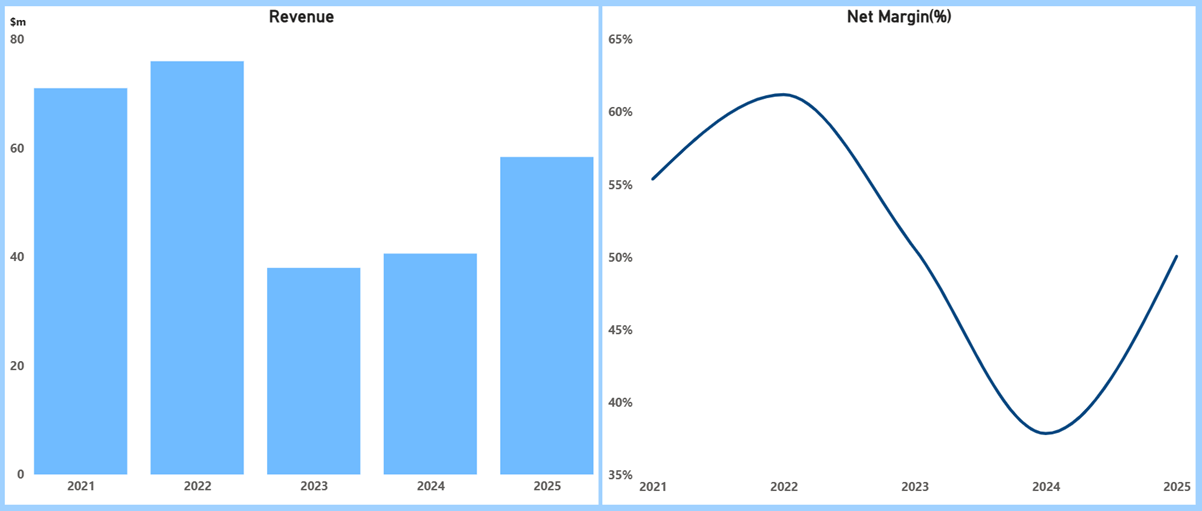
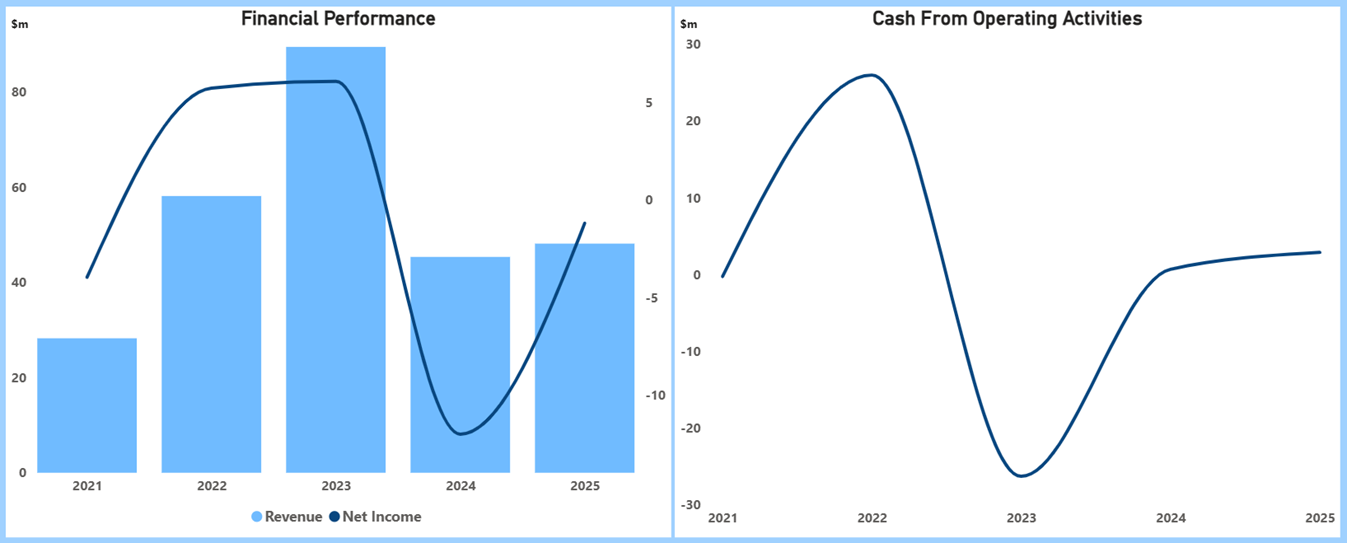
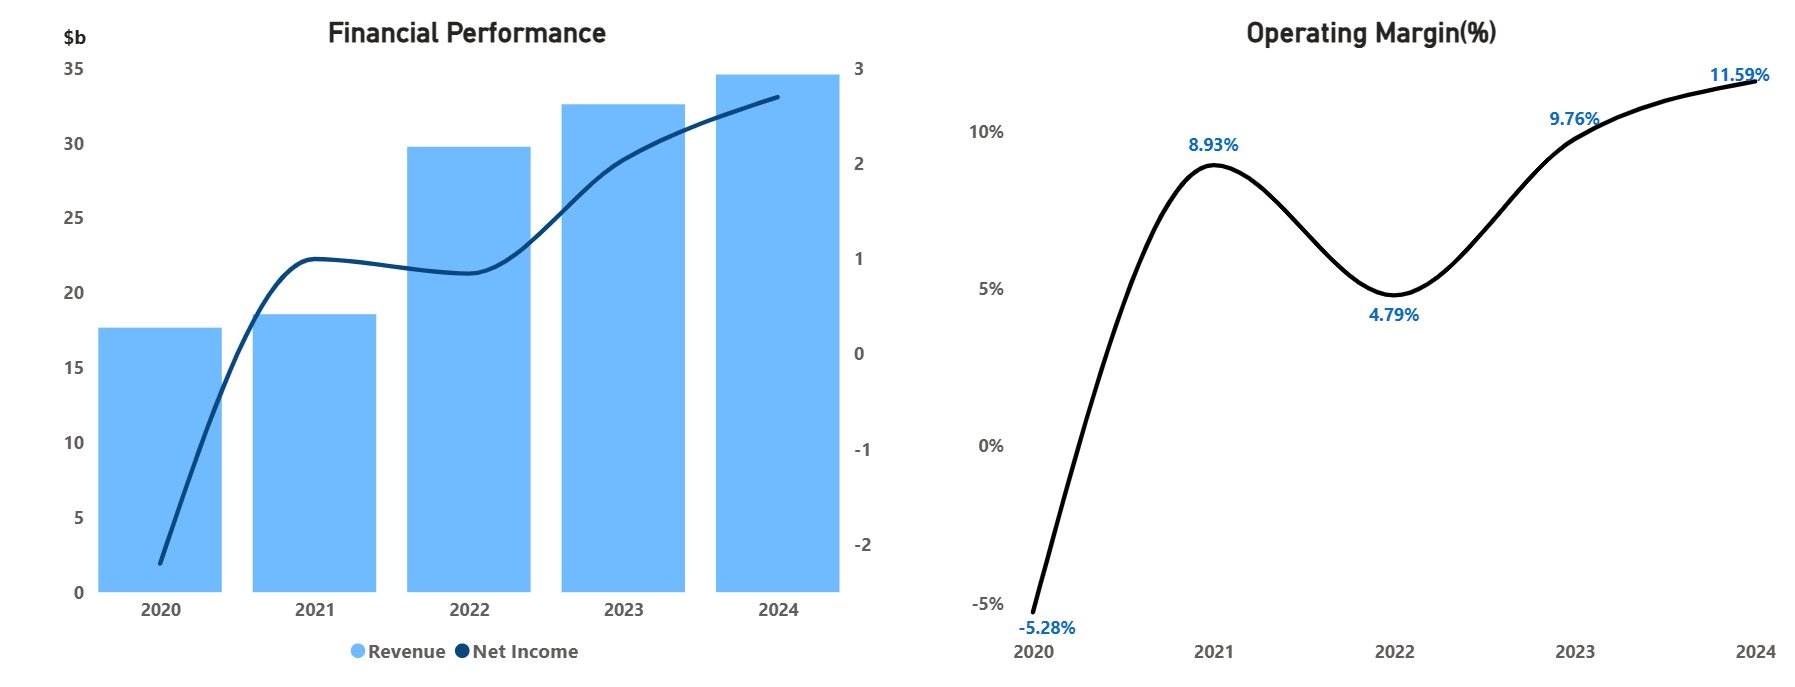
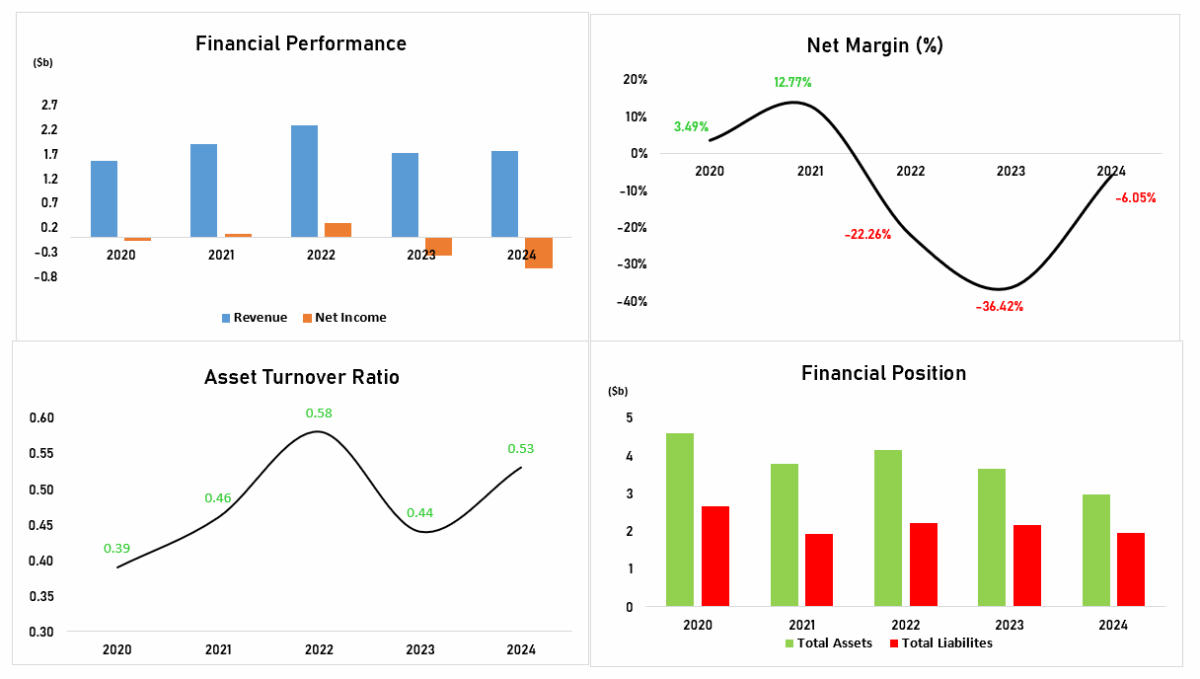
(Data Source: TradingView. Graphic Source: Pristine Gaze)
- Revenue top line was subdued from $0.5 million in 2021 to $0.46 million 2024 reflecting the pre‑commercial phase and customer qualification period. FY2025 inflected to $3.8 million as powder sales and PM‑HIP orders scaled, aided by commissioning of a second EIGA atomizer and initial commercialization progress.
- Cash trended from about $11.5 million (FY2021) down to $8.8 million (FY2023) before rebuilding to $12.0 million (FY2024) and $19.2 million (FY2025), providing runway for execution and working capital as commercial volumes ramp. Management attributes the stronger FY2025 cash position to capital initiatives and operating momentum, alongside a five‑year exclusive powder supply agreement with Velo3D that underpins forward demand visibility.
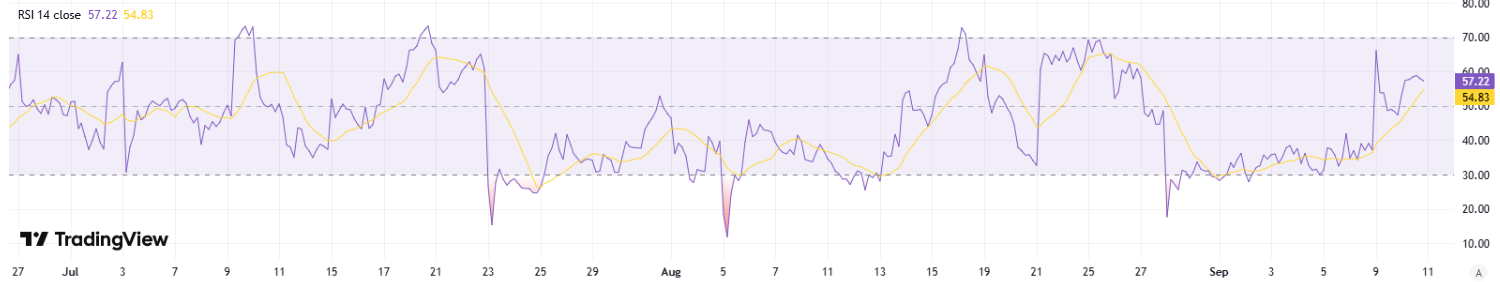
Relative Strength Index (RSI) Analysis:
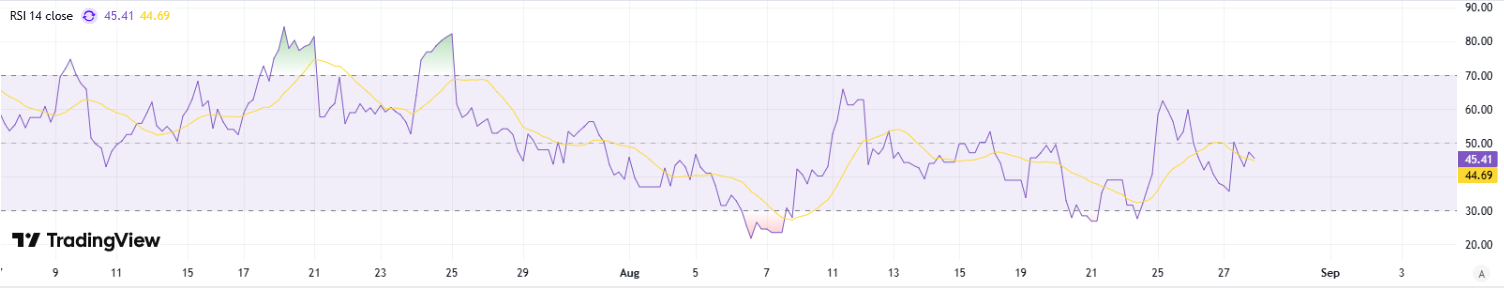
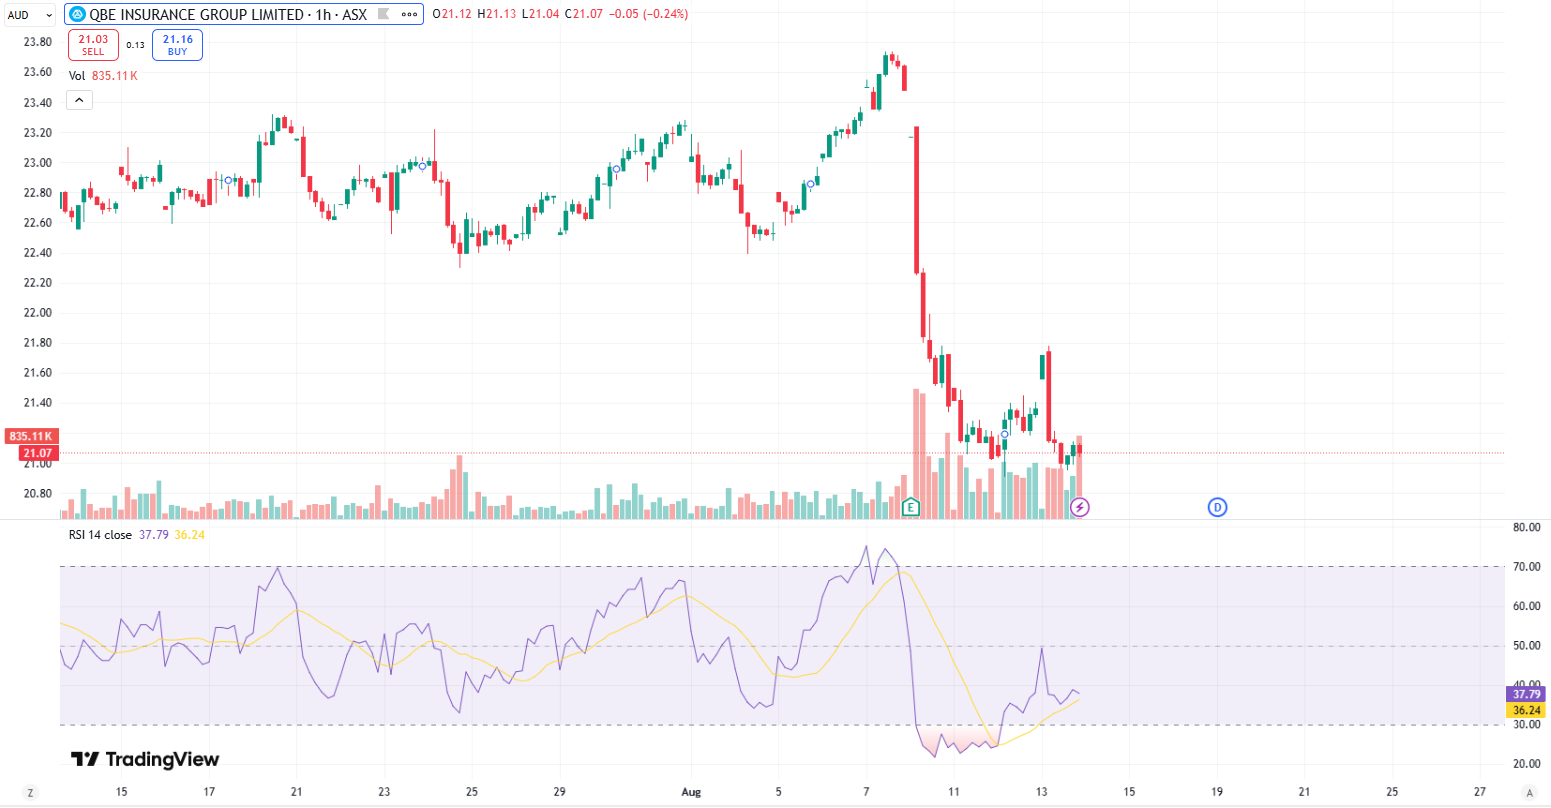
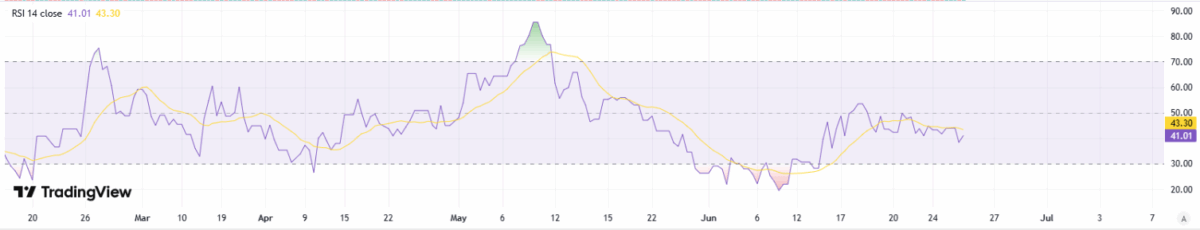
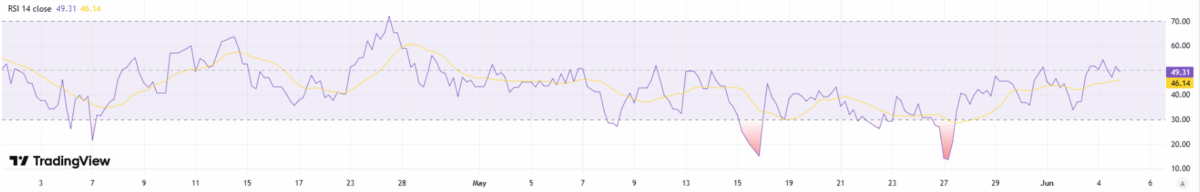
Hourly-Time Frame (HTF)-
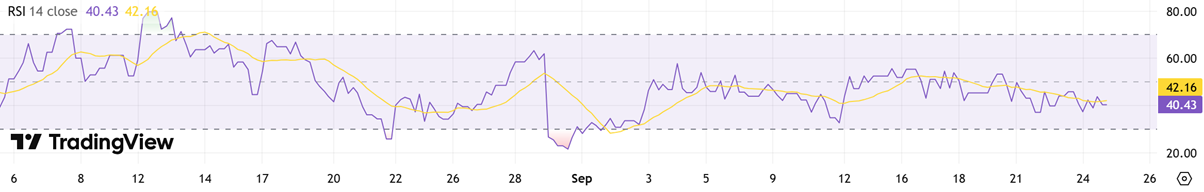
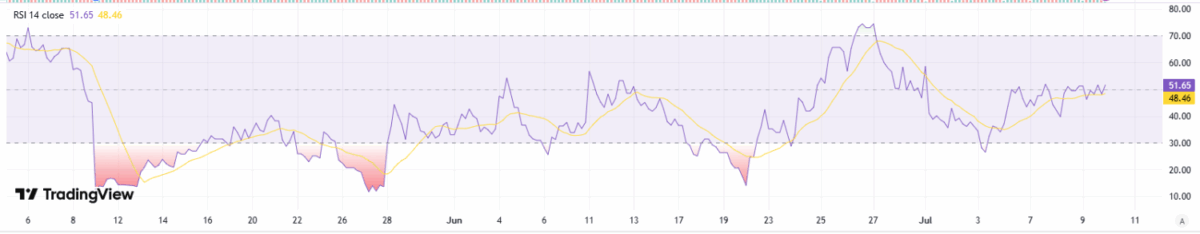
(Graphic Source: TradingView)
3DA’s hourly RSI is lifting through the 47.65 zone toward 50, pointing to steady improvement as sellers lose control and dip‑buyers step in. A firm close above 55 would confirm momentum rotation and set up a constructive base, with shallow pullbacks likely to be supported rather than sold. If the gauge can hold above the midline while price stays stable, a short burst to 60–65 is feasible, aligning with a near‑term rebound setup and a more positive bias for coming sessions.
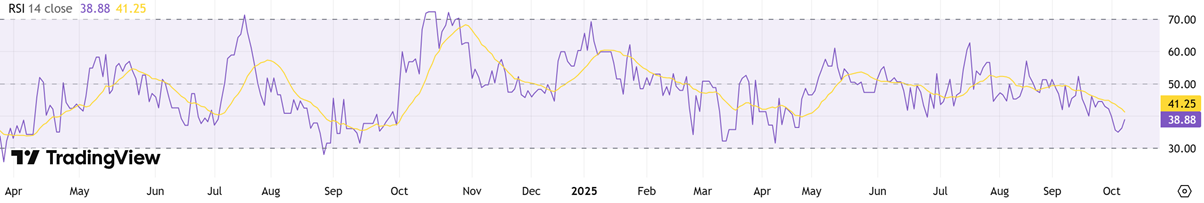
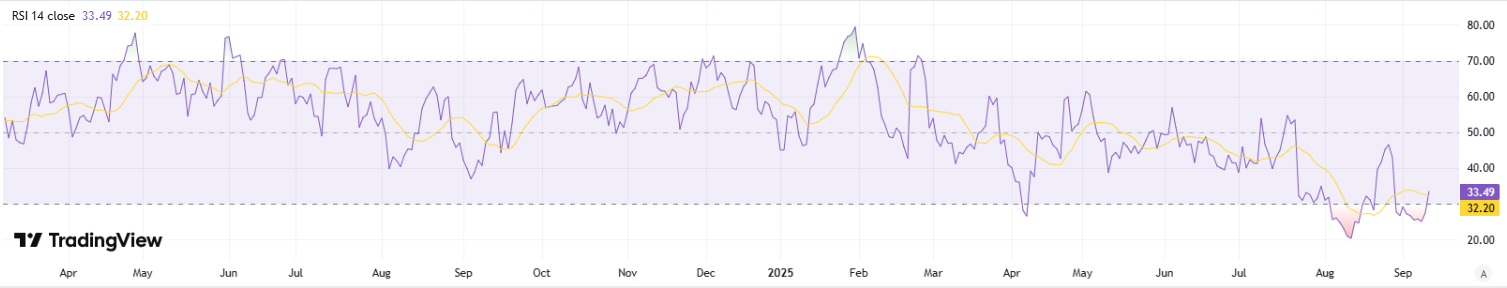
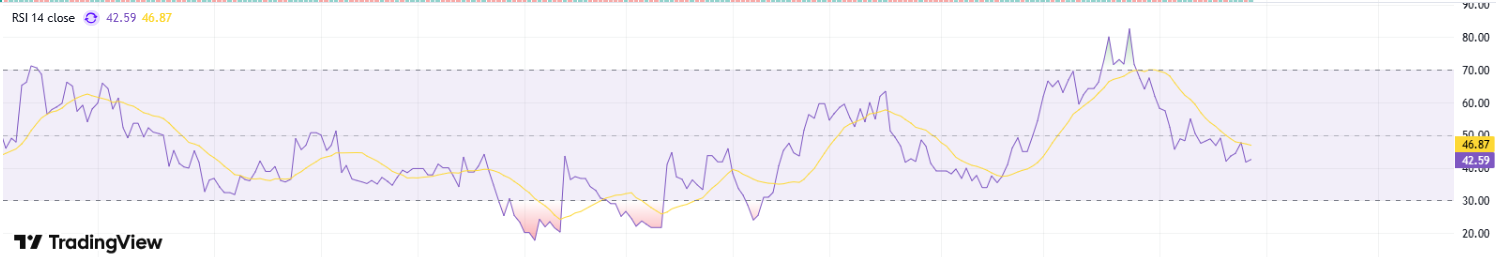
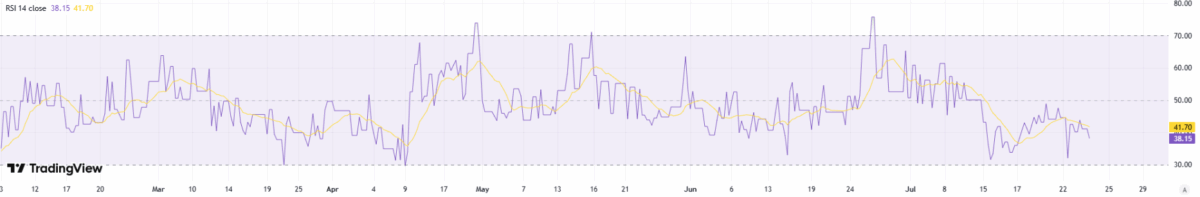
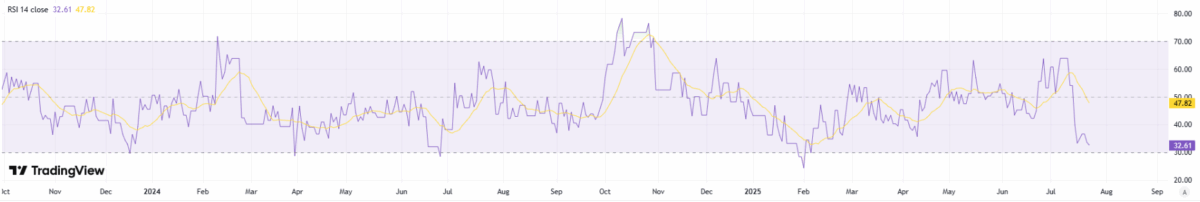
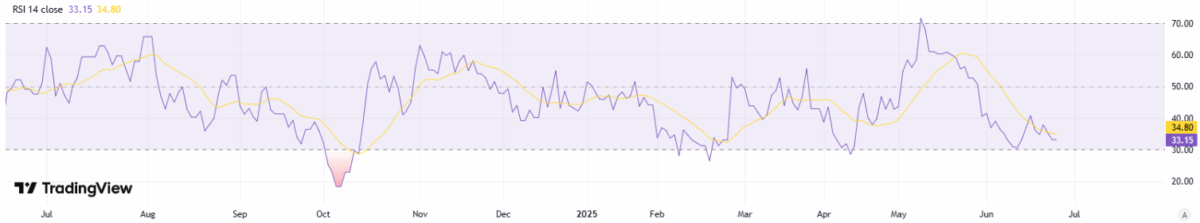
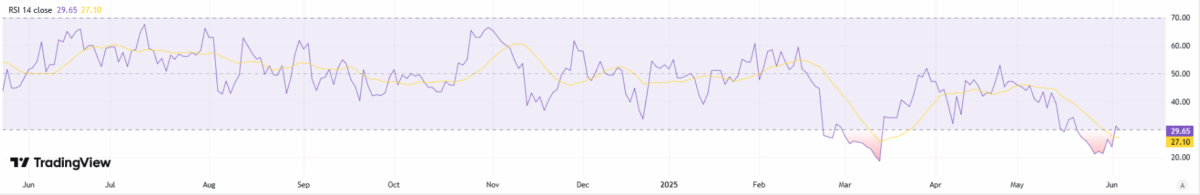
Daily-Time Frame (DTF)-
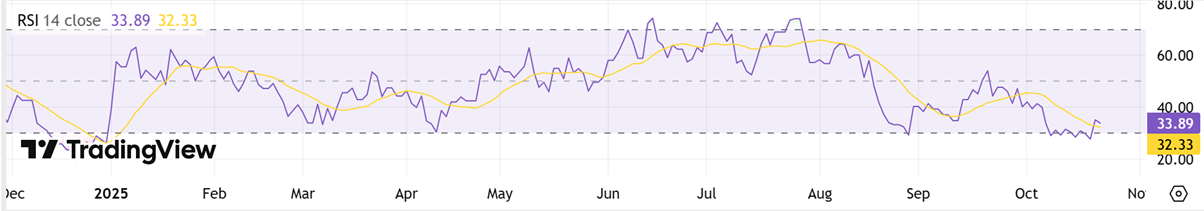
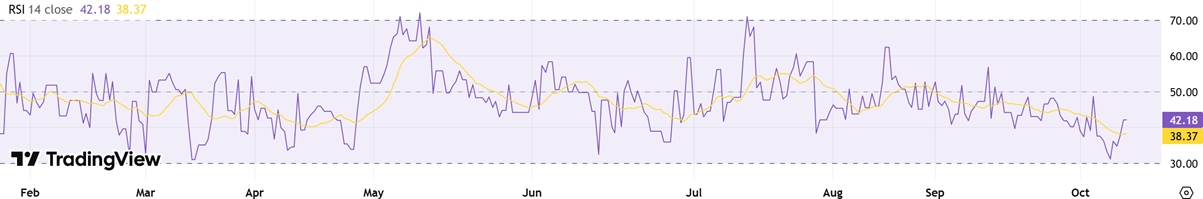
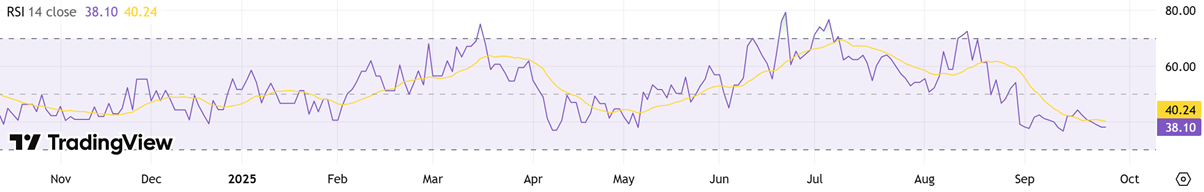
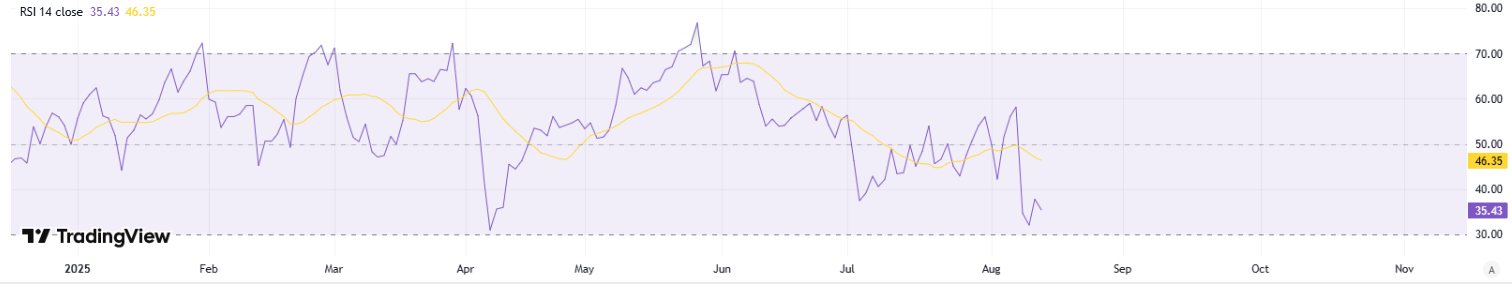
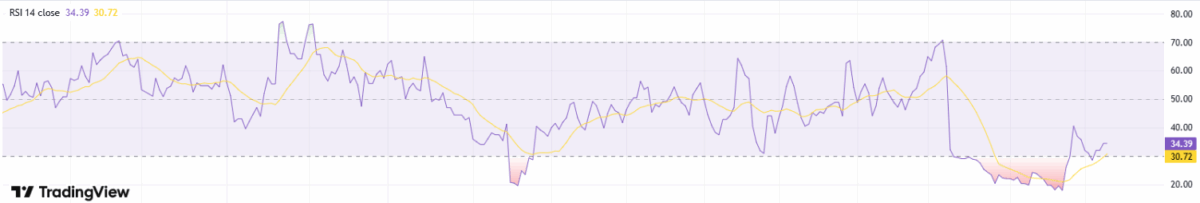
(Graphic Source: TradingView)
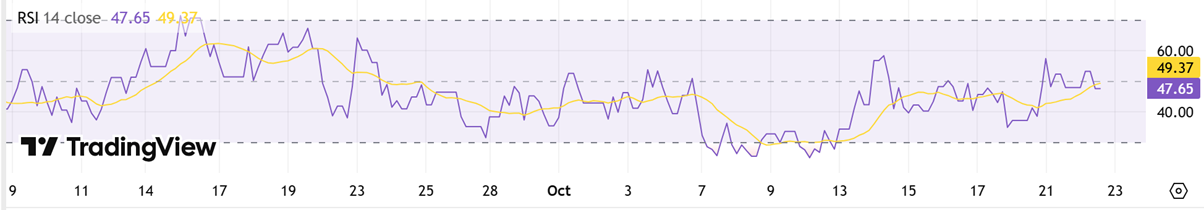
On the daily chart, RSI recovering into the high‑30s to low‑40s signals easing downside pressure and a return of measured buying interest. This upturn after oversold readings often precedes basing; holding above 40 would strengthen the case for consolidation before a push toward 45–50. A breakout in RSI through 50 alongside tight price ranges would add confirmation of a short‑term reversal, improving risk‑reward for incremental longs while keeping risk controls beneath recent swing lows.
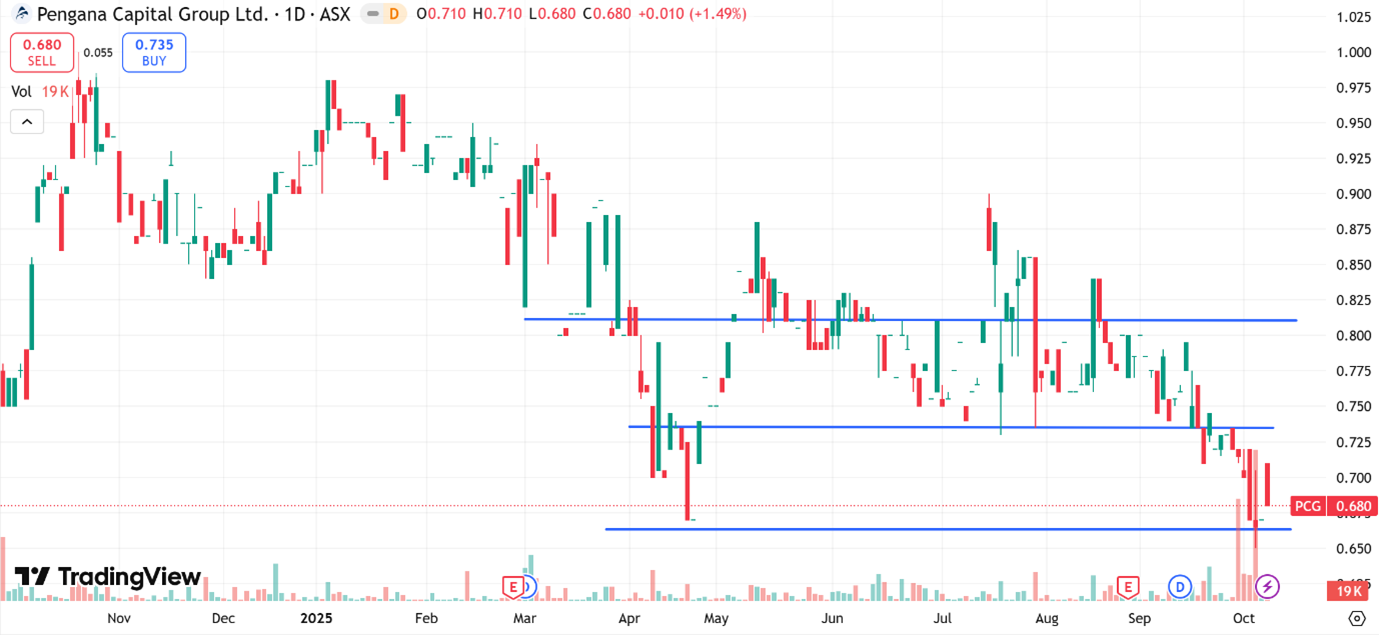
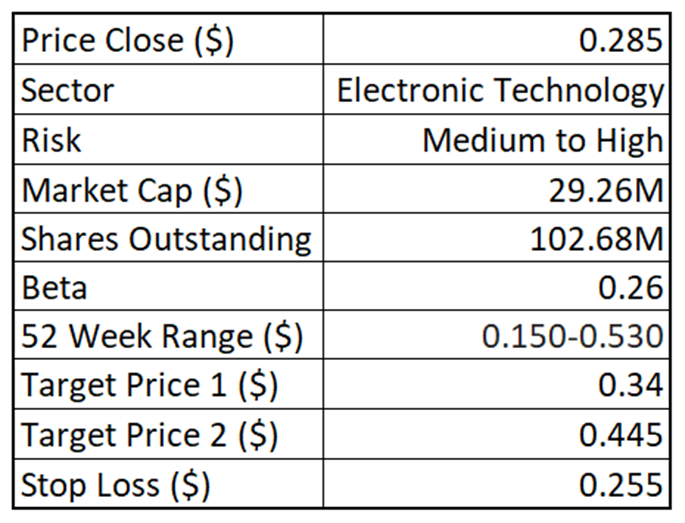
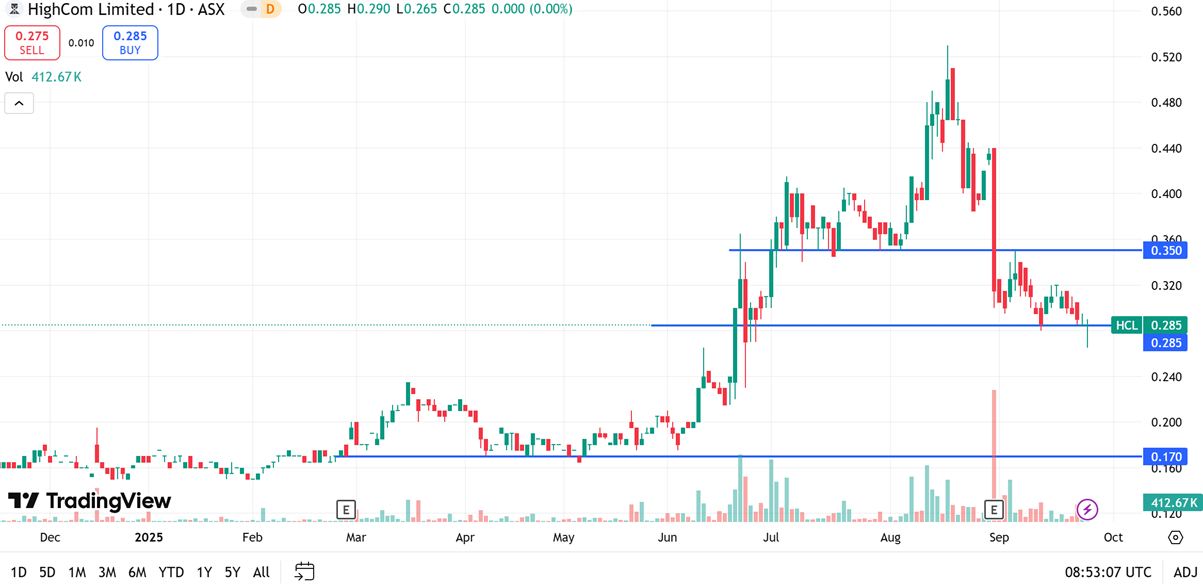
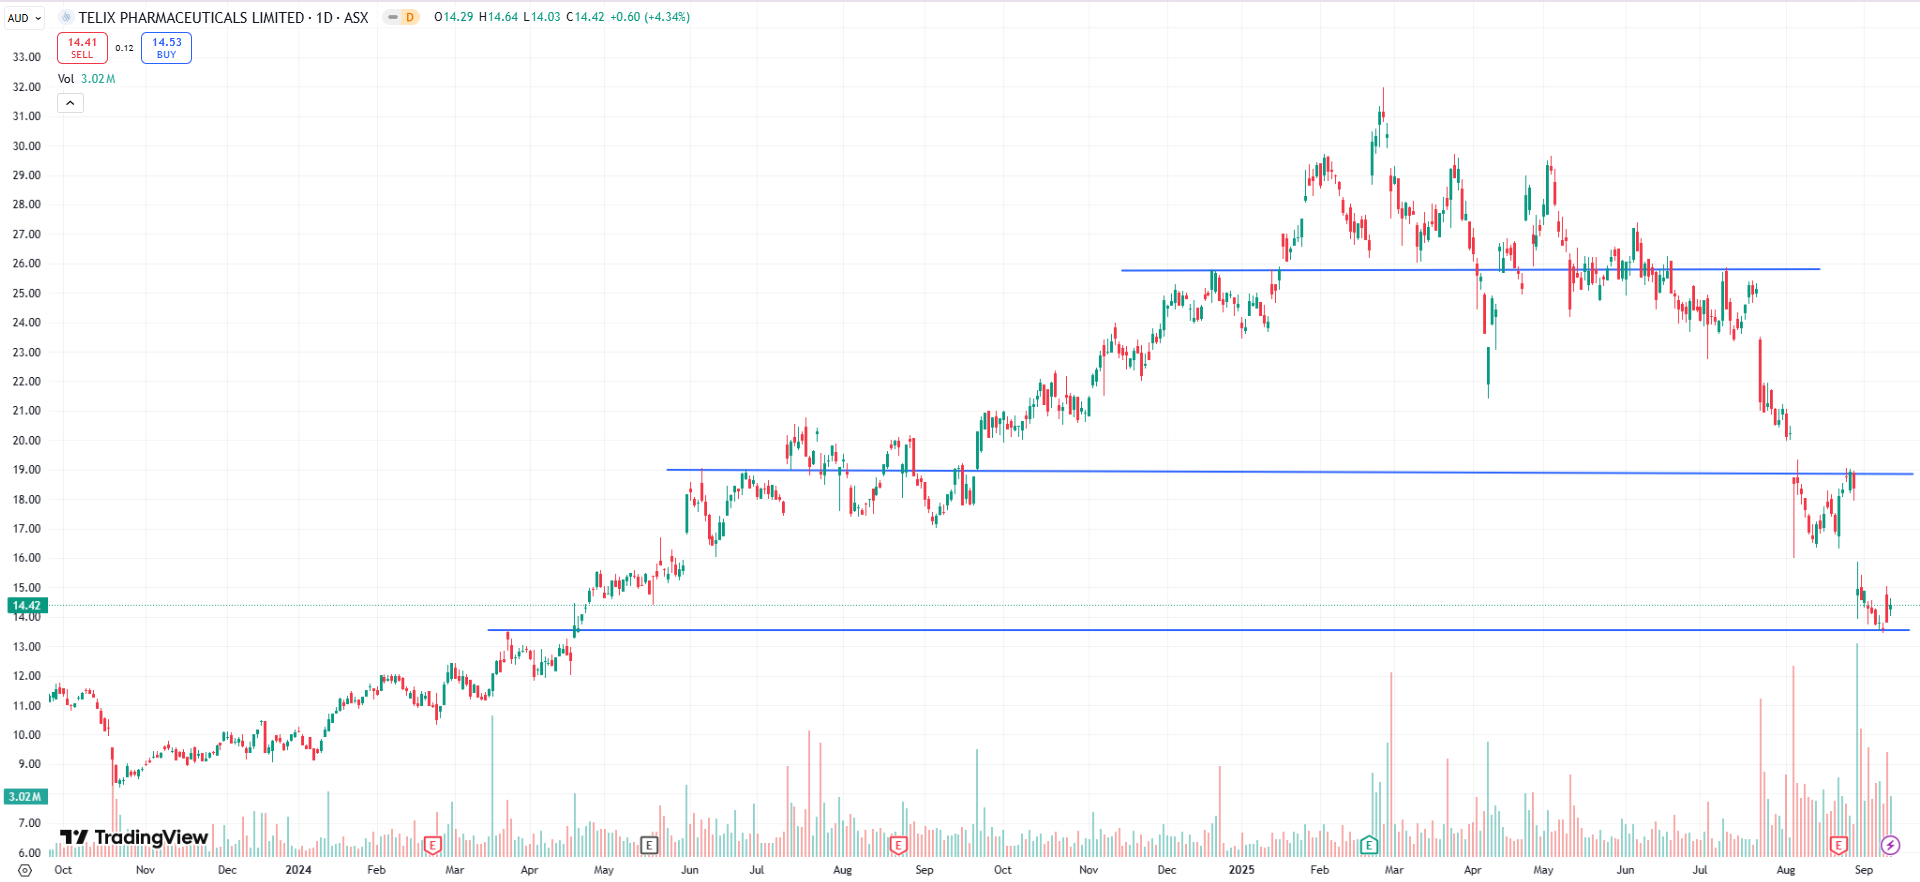
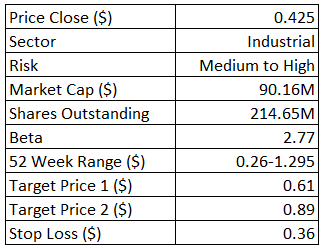
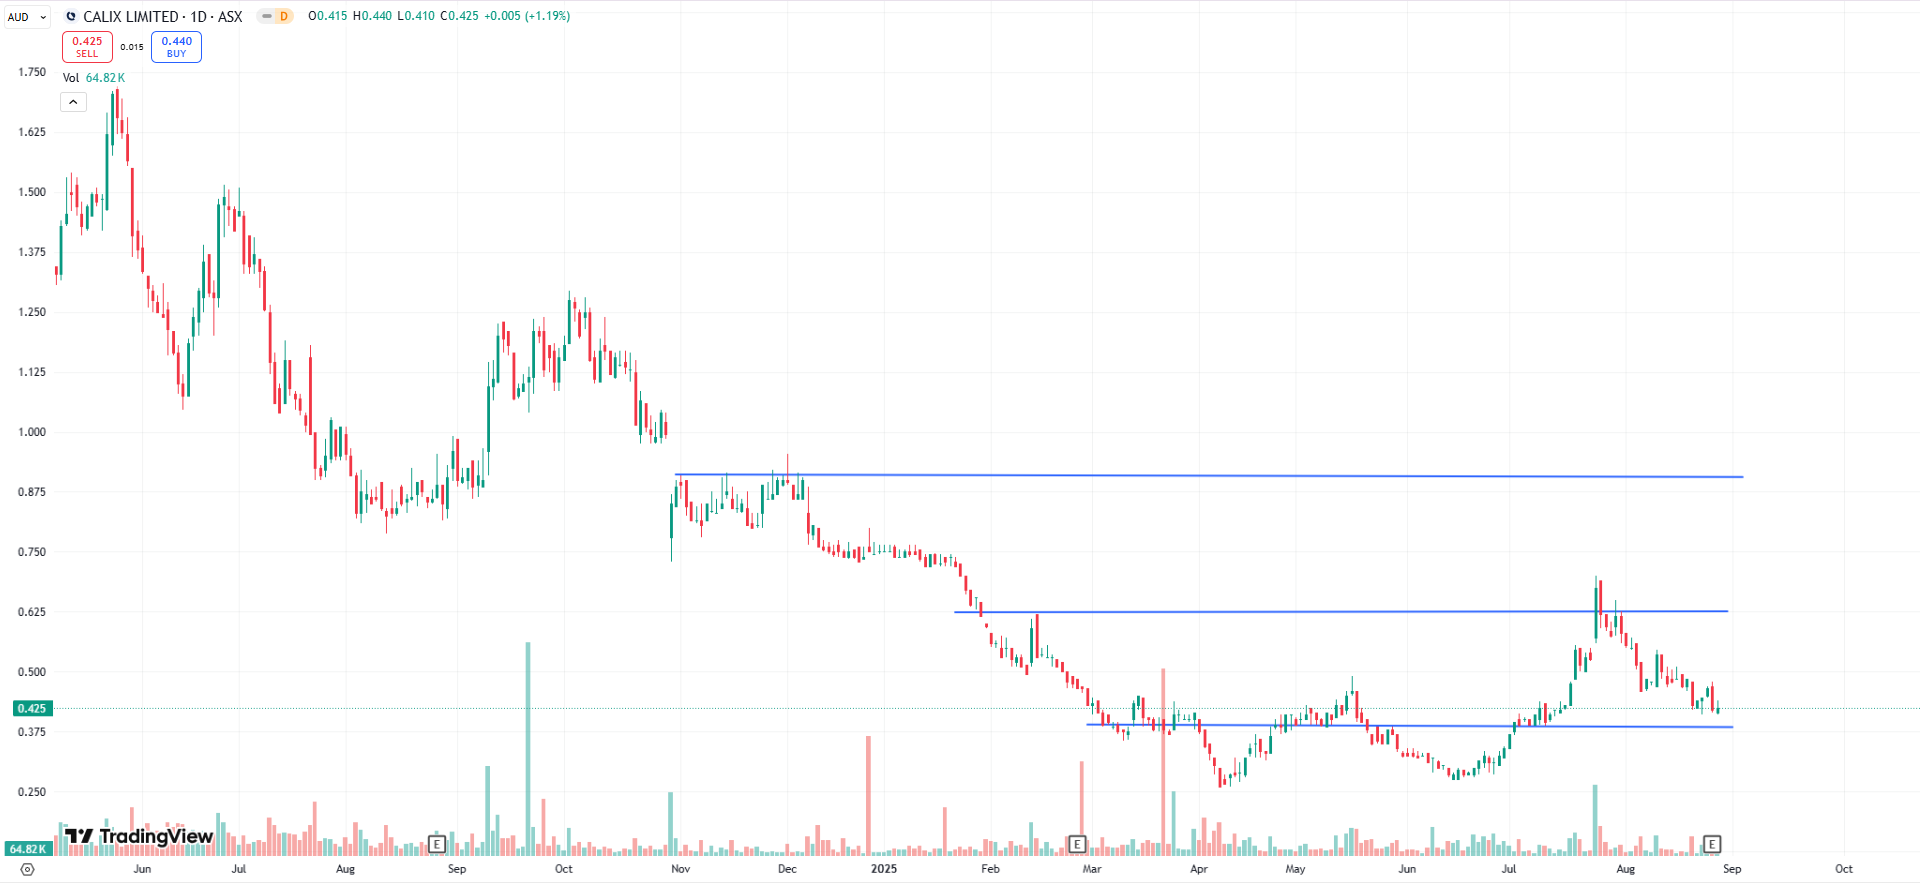
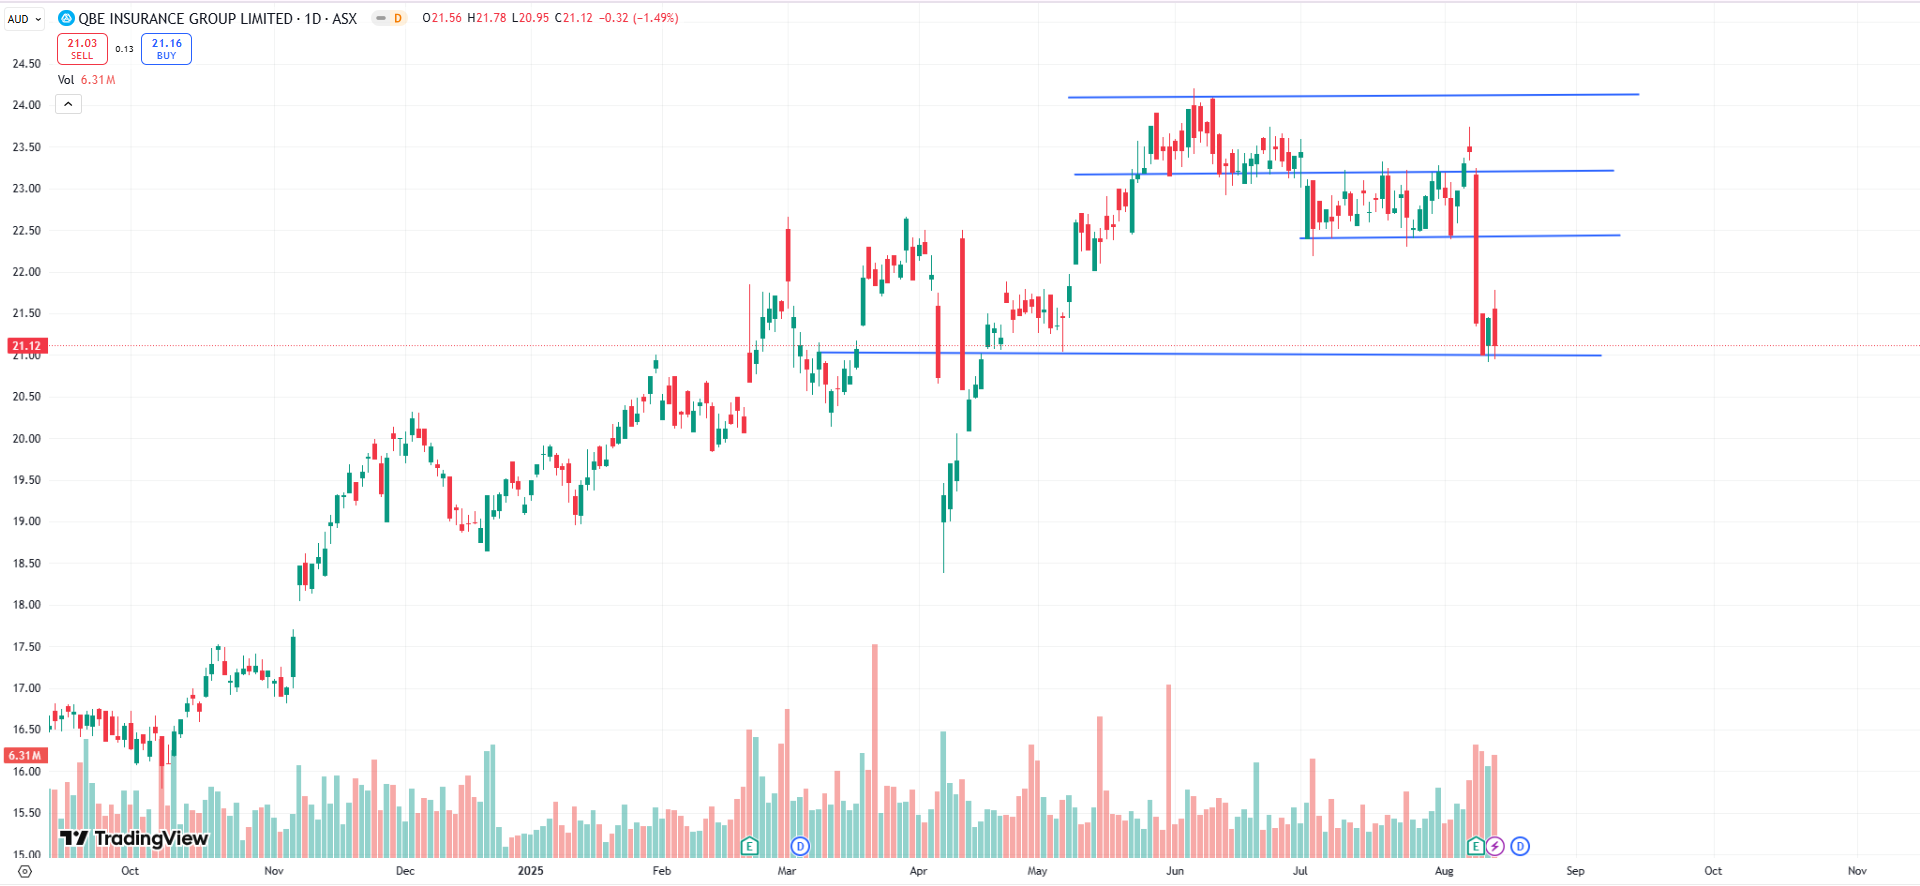
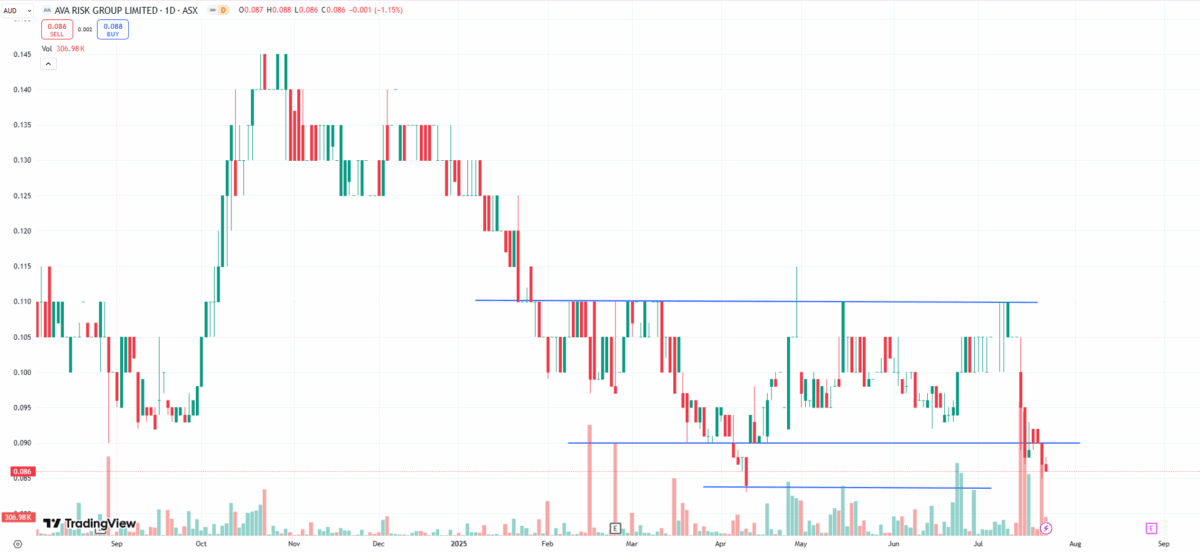
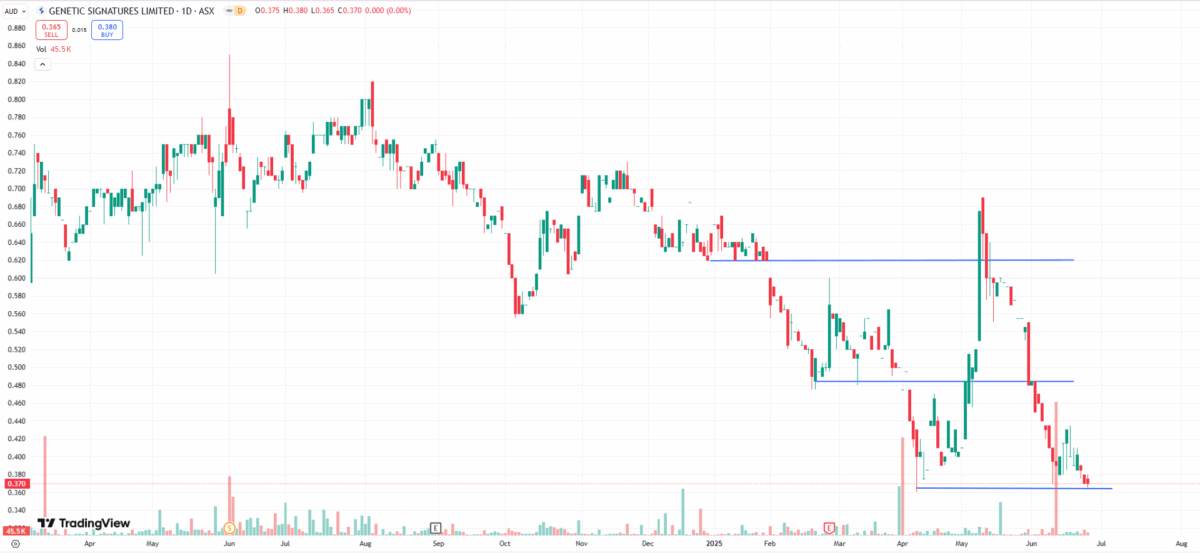
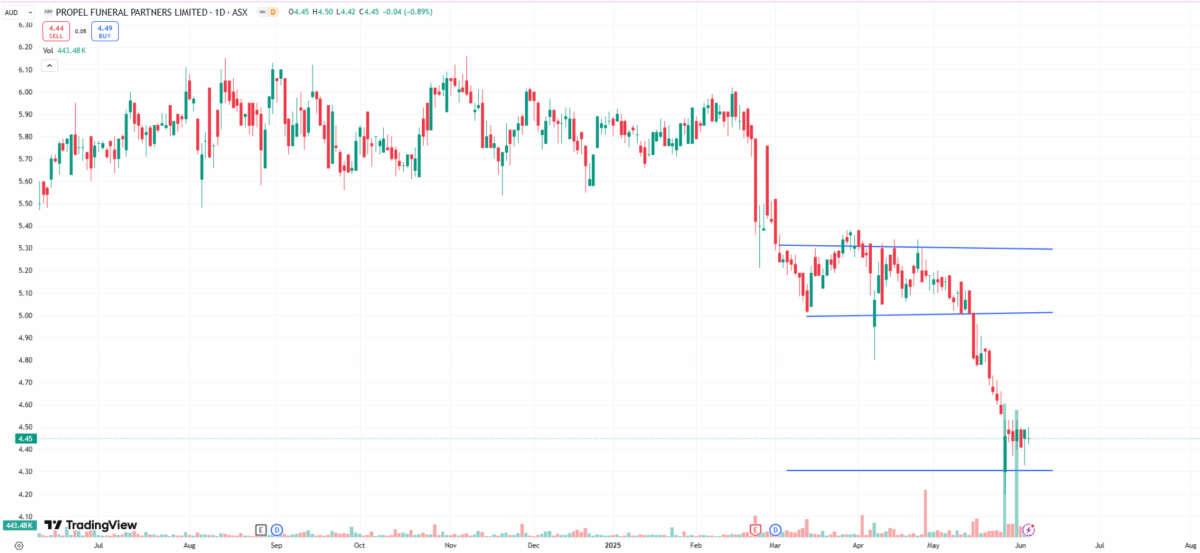
Support and Resistance Analysis:
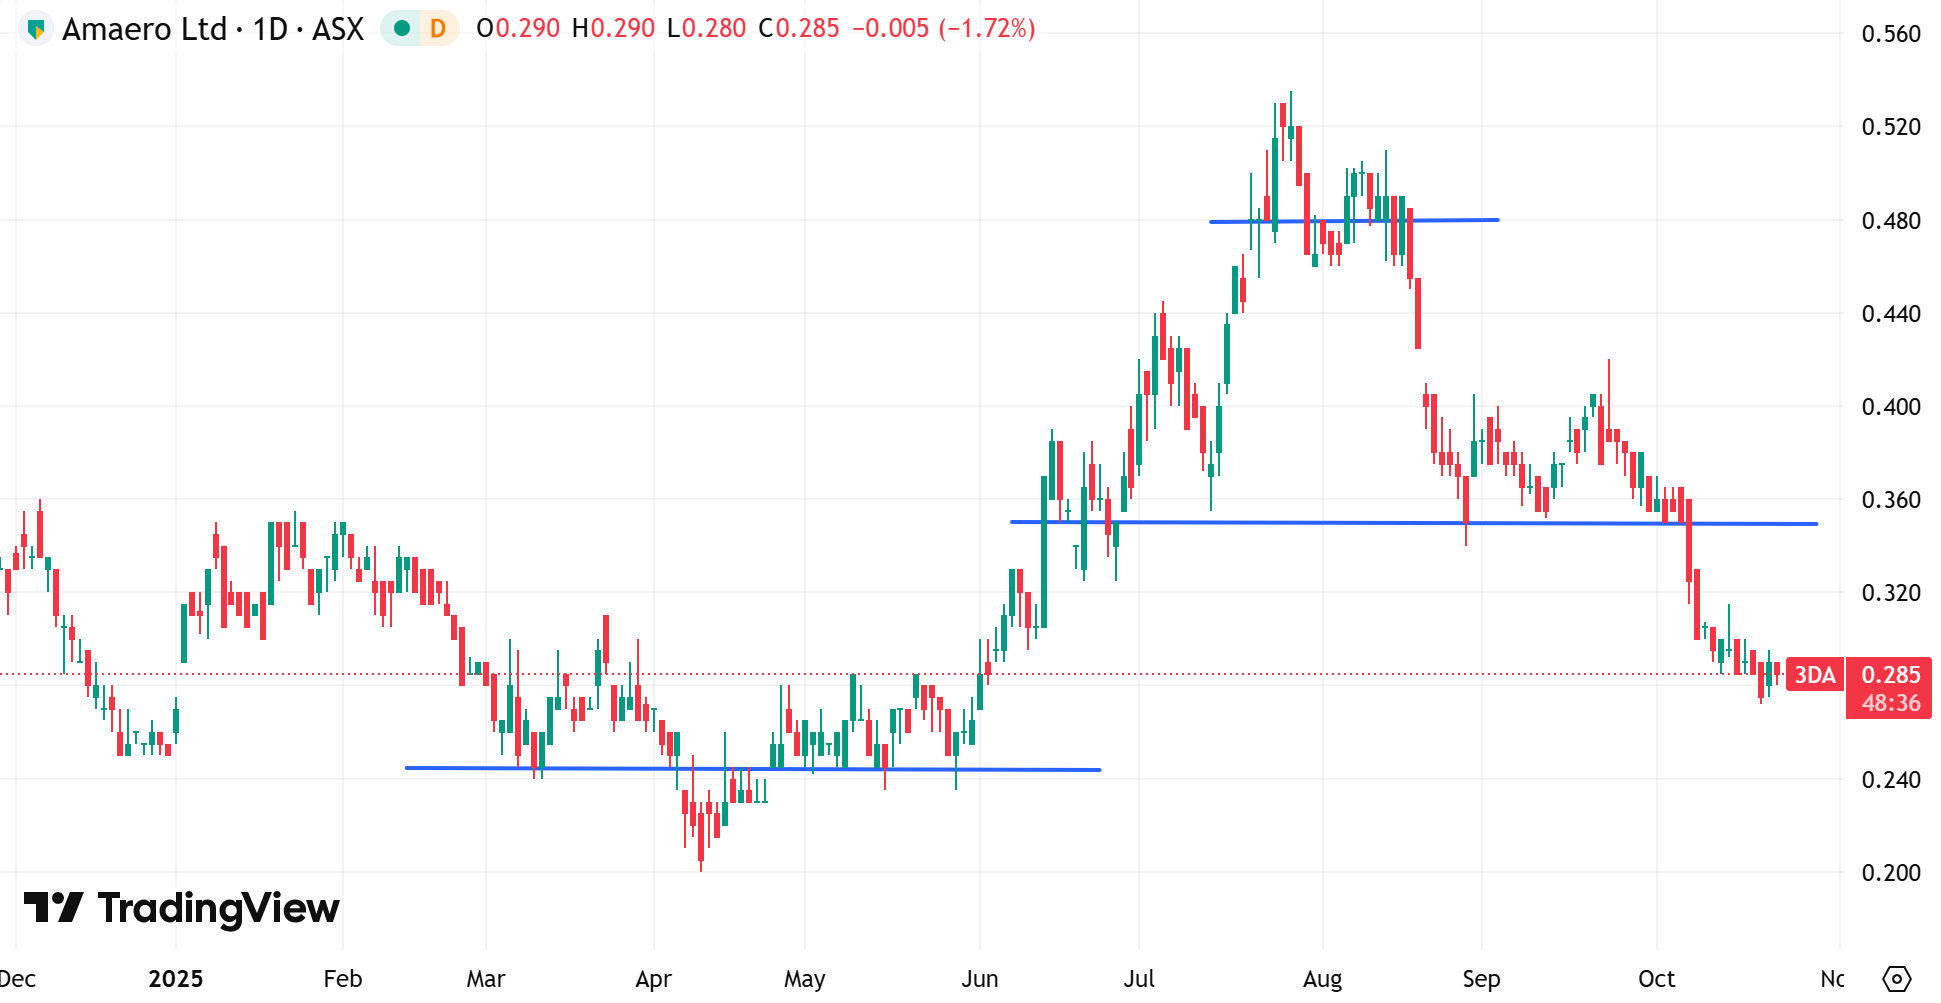
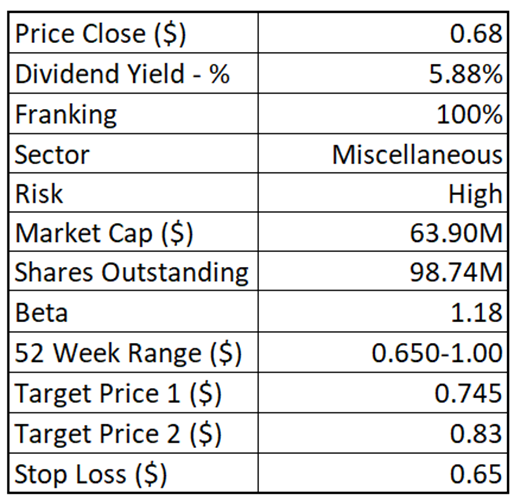
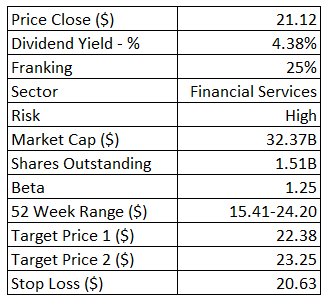
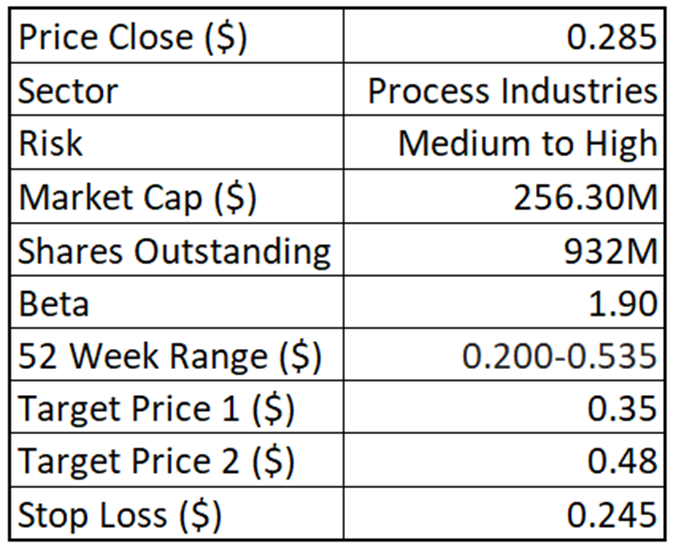
3DA may see some near‑term noise, but downside looks limited with firm support at $0.245, where recent lows cluster and buyers previously stepped in to defend the trend’s base. Above, the first resistance sits near $0.350; a daily close over this shelf would likely pull price back into the broken range and reduce supply pressure from October’s breakdown zone. The next resistance is at $0.480, which capped rallies during the August peak and marks the upper range; with price near support and two clear targets overhead, risk‑reward skews positive if $0.35 and then $0.48 clear.
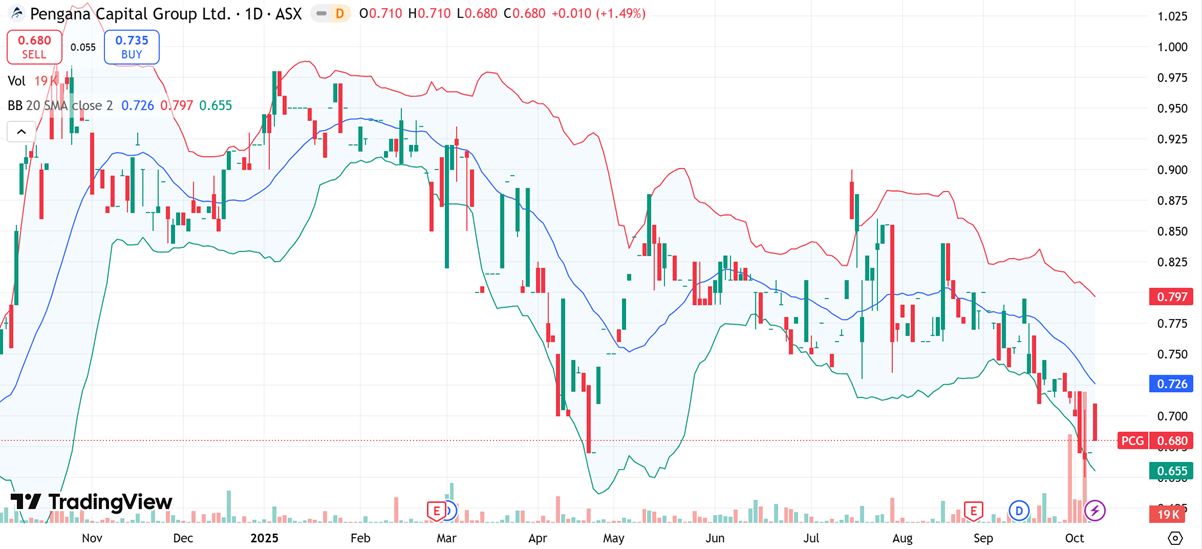
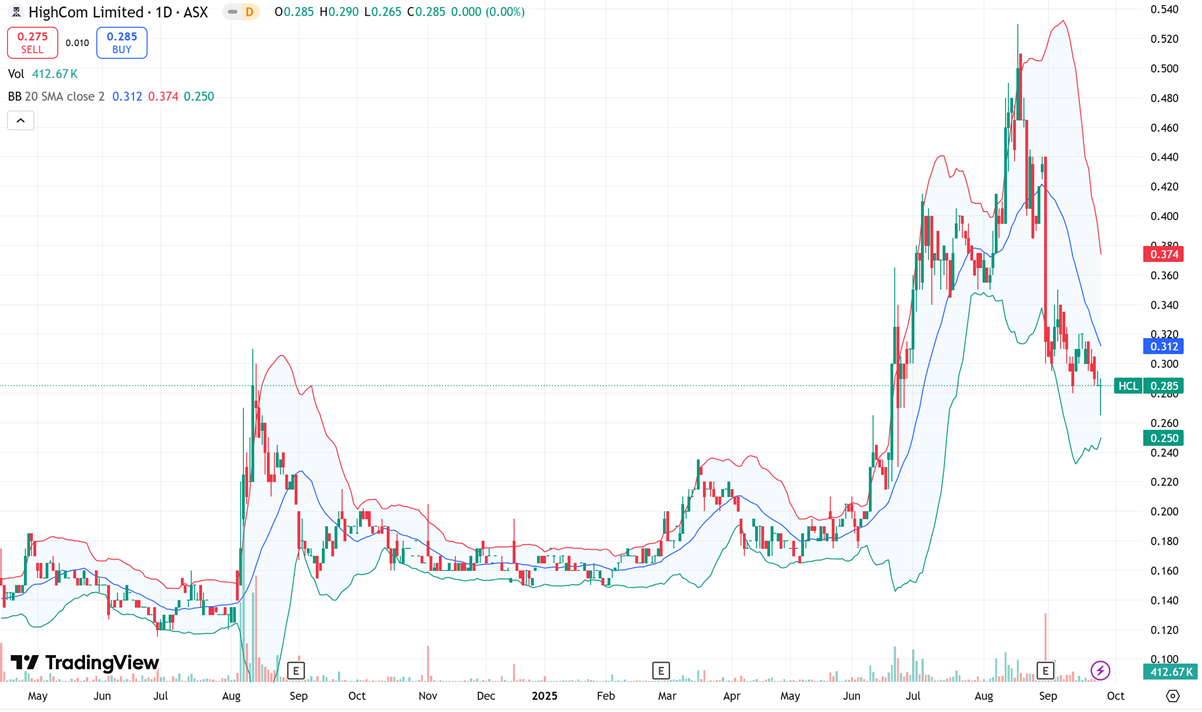
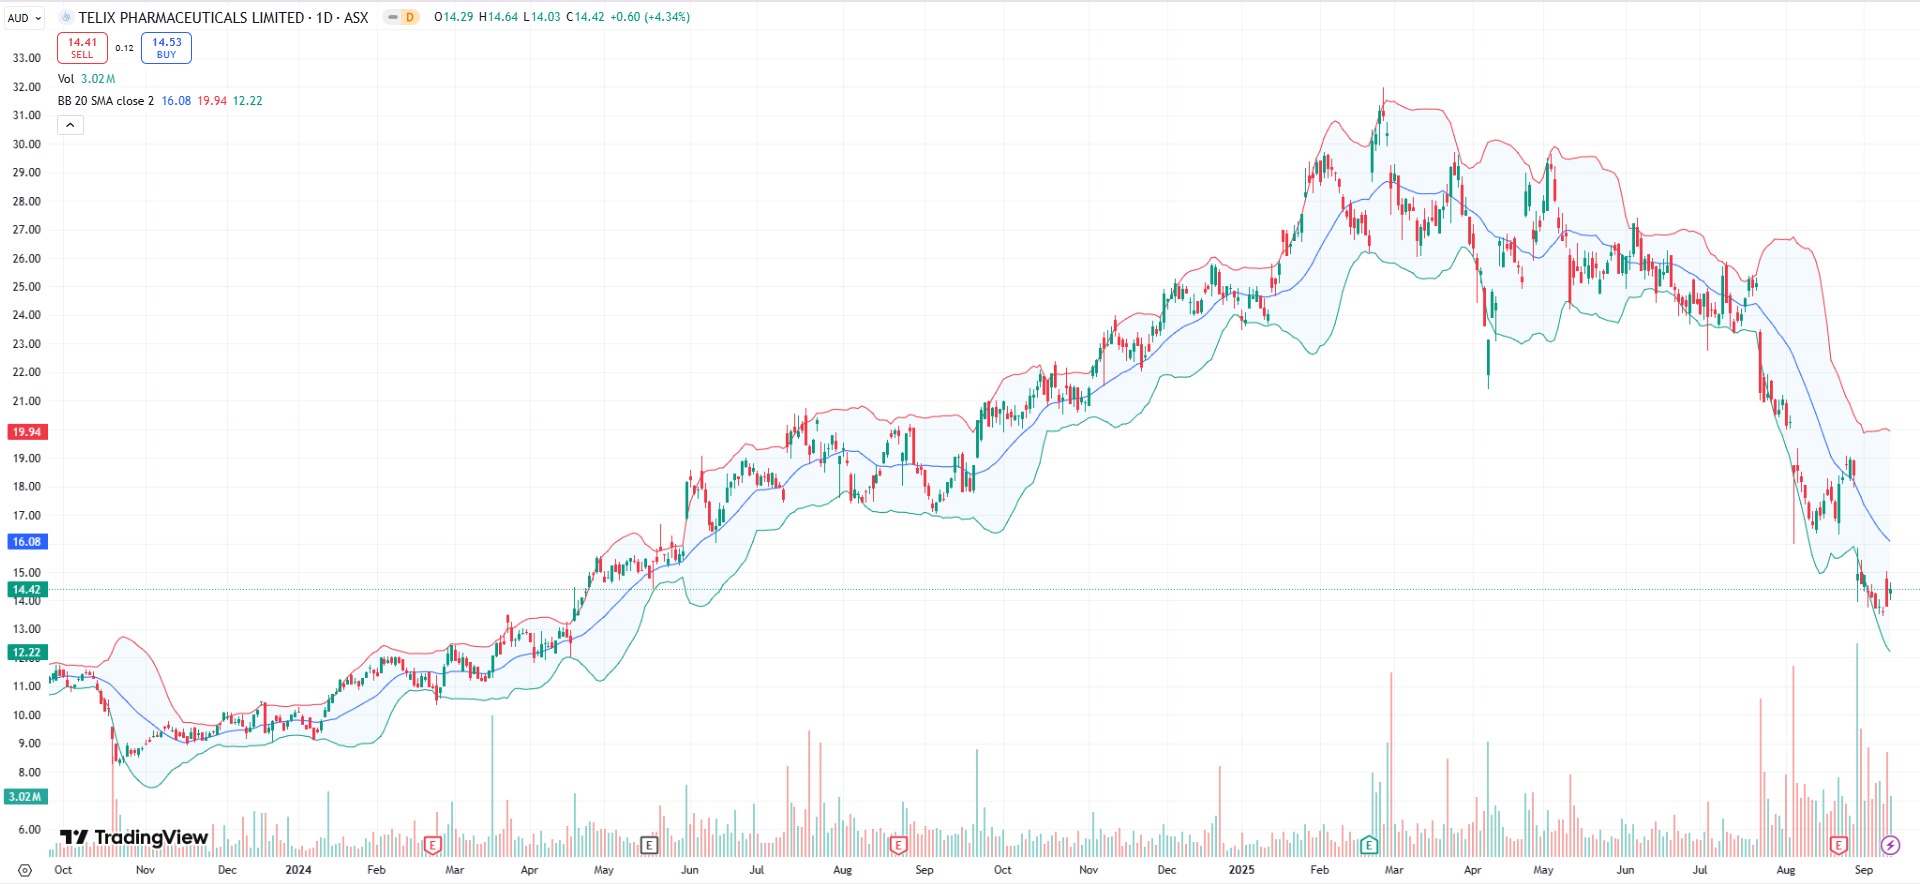
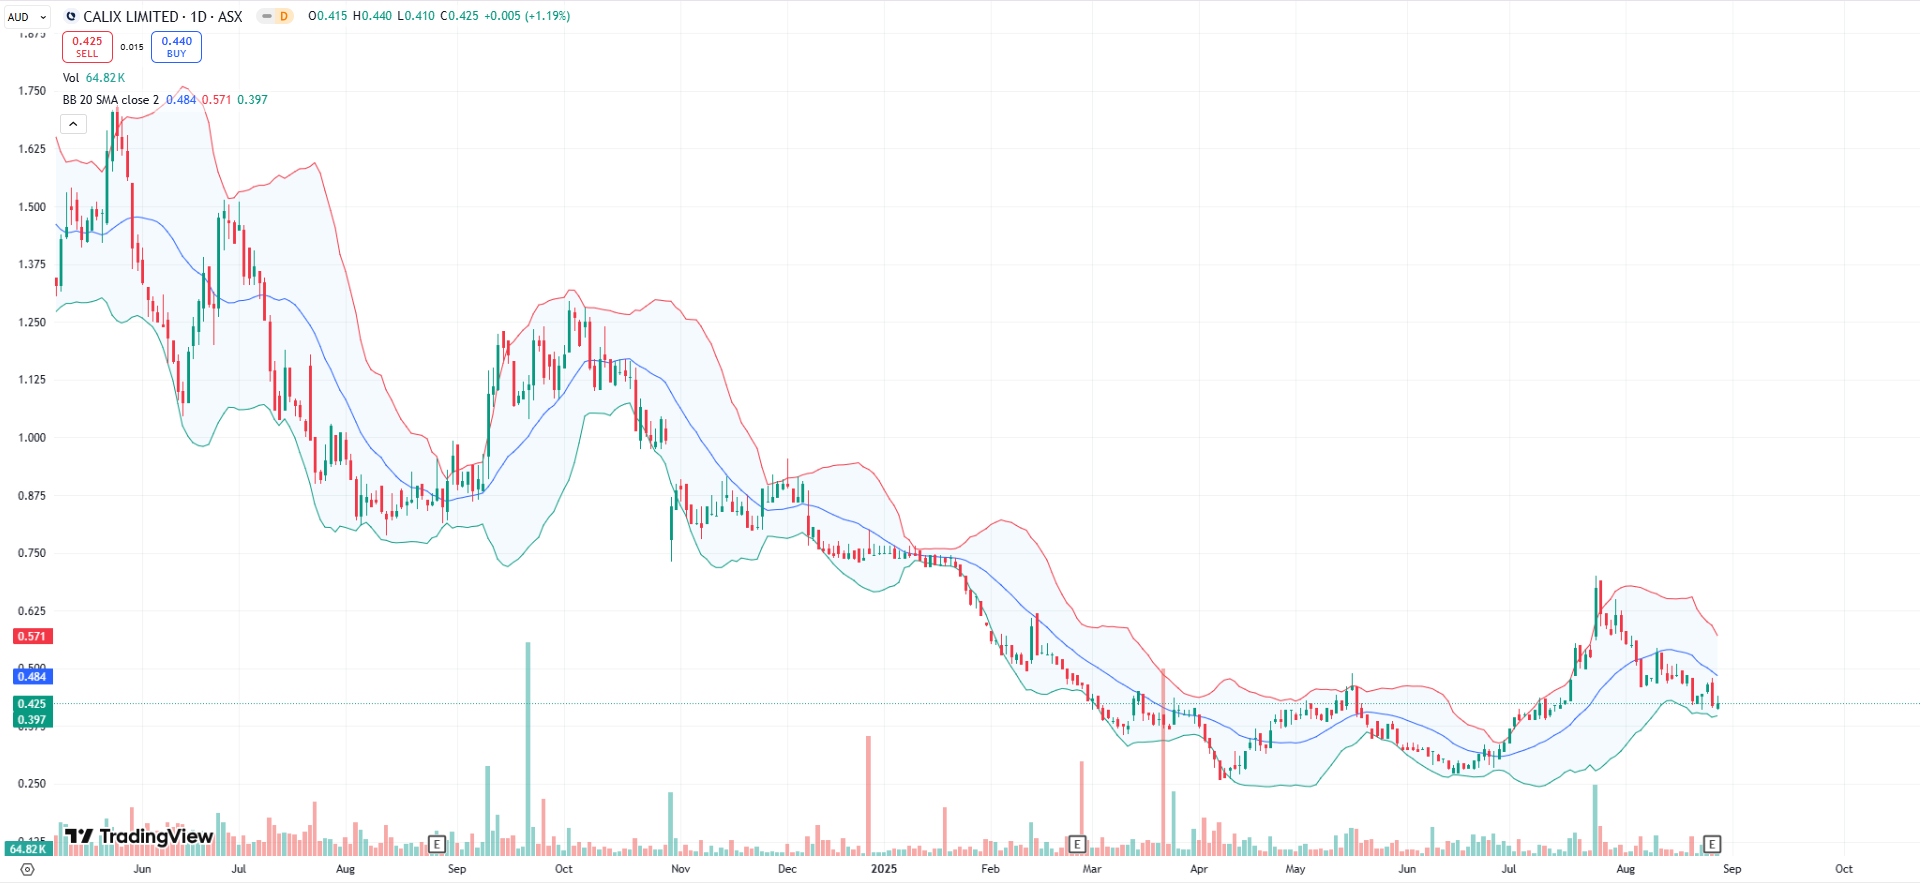
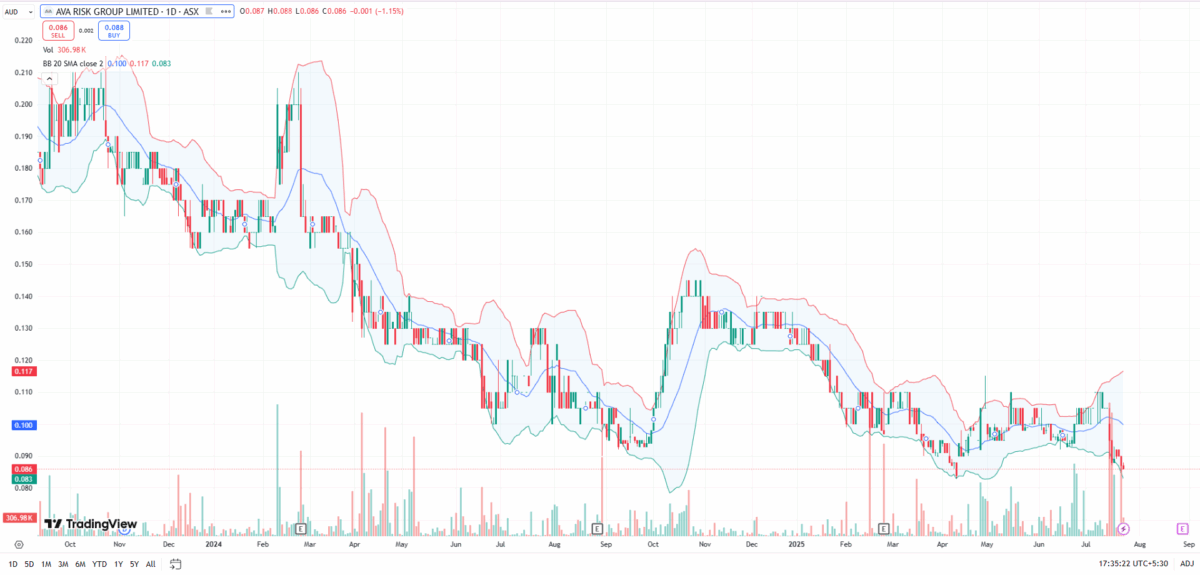
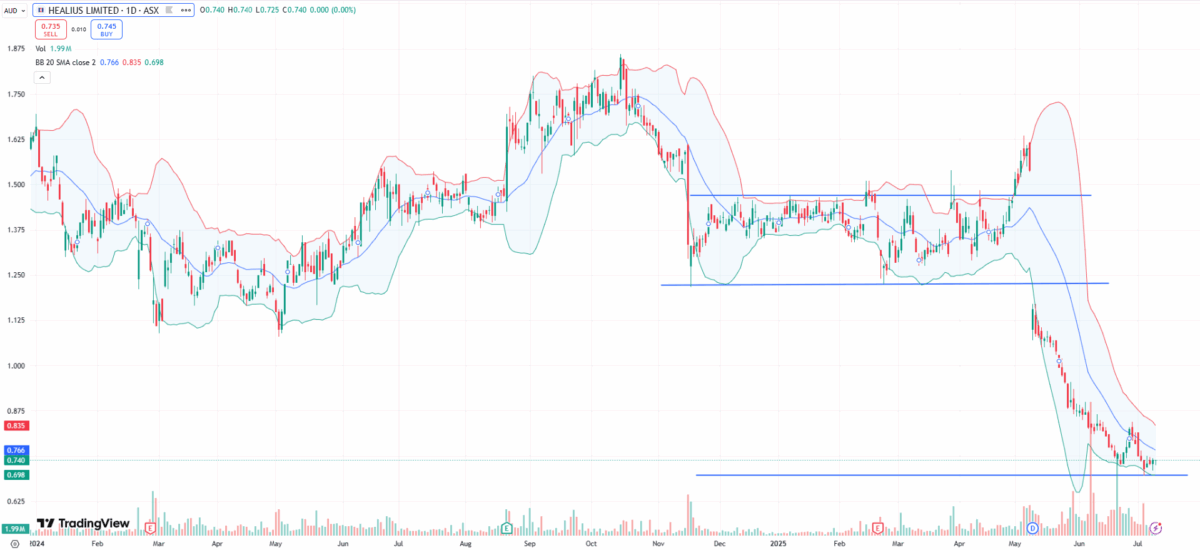
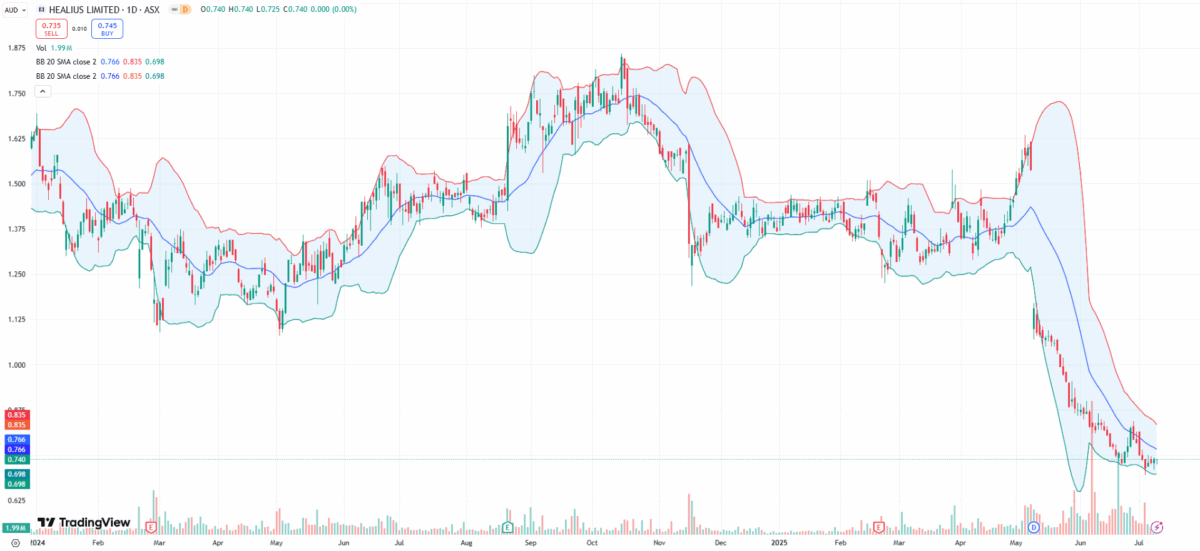
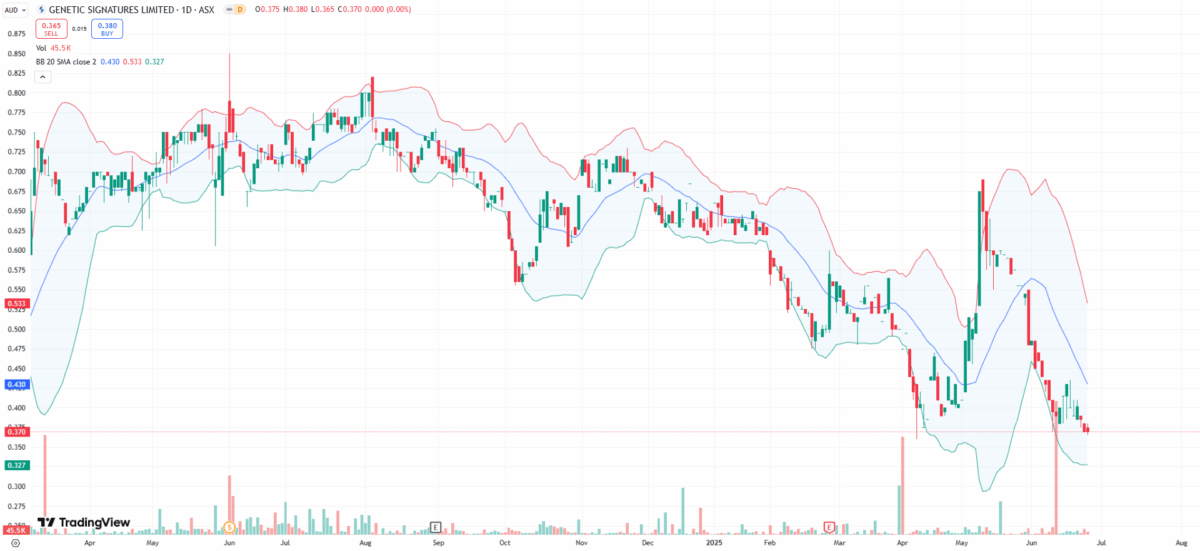
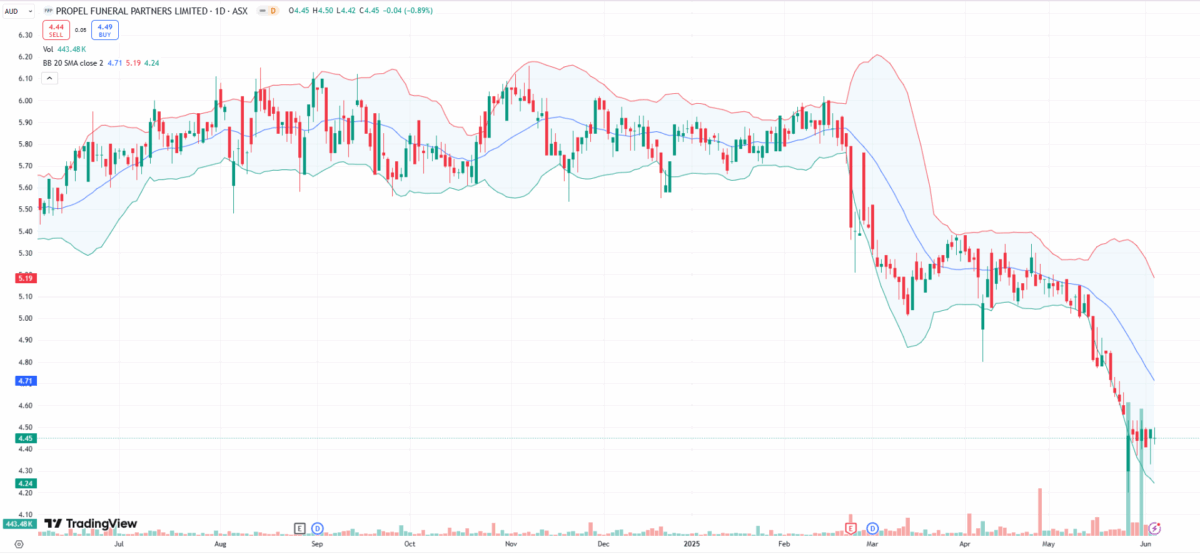
Bollinger Band Analysis:
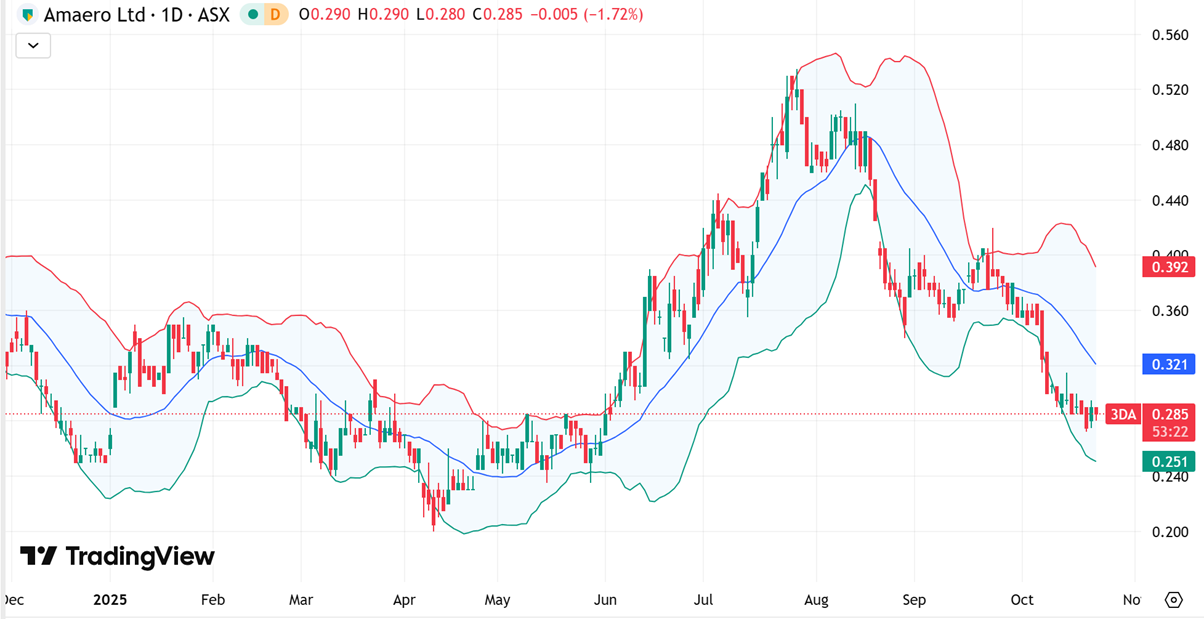
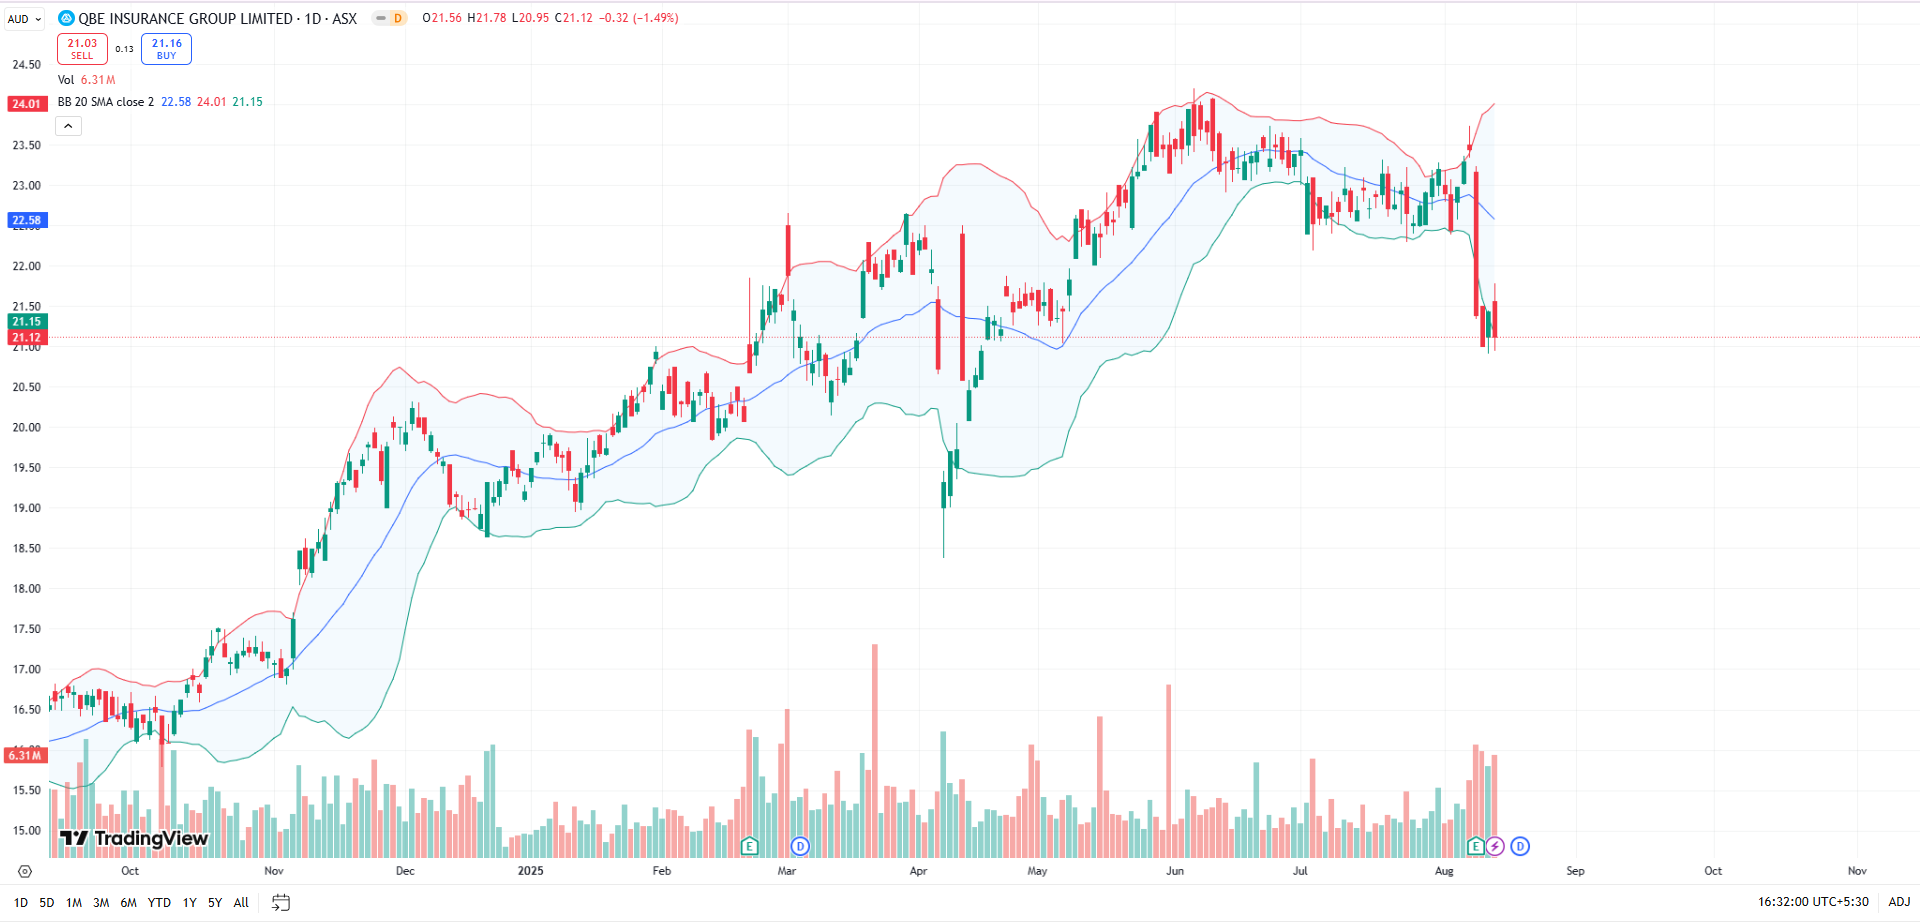
(Graphic Source: TradingView)
3DA is trading near the lower band around $0.25–$0.29, showing price is stretched on the downside and sellers are losing momentum as candles ride the band less aggressively. The mid‑band (20‑day average) near $0.32 is the first checkpoint; a close above it would signal mean reversion and increase odds of a push toward the upper band near $0.39. Band width has expanded after the recent drop and is starting to steady, which often precedes a pause or bounce if price can base above the lower band.
Analyst Take
Amaero Limited is moving from setup to scale, with demand locked in and capacity funded, giving clearer revenue visibility than typical early‑stage industrials. A multi‑year, exclusive supply partnership with a leading U.S. printer OEM underpins repeat powder volumes and embeds Amaero’s materials into customer workflows, strengthening switching costs. Recent financing and export‑credit support fully cover the current capex program, lowering execution risk as additional atomisers come online and PM‑HIP volumes build. With early FY26 coverage identified and operations aligned to U.S. re‑shoring in defence, space, and aviation, Amaero offers a de‑risked path to step‑change growth and operating leverage into FY27.
As per Pristine Gaze, you may consider a “Buy” on “Amaero Limited” at the closing price of “$0.285” (As of 22 October 2025).
*All currency figures are in Australian Dollars unless stated otherwise.
*All data sourced from company reports and TradingView.
Disclaimer
The reports provided by Pristine Gaze are designed to deliver general financial insights, including stock and sector market analysis and investment commentary. These reports aim to support informed decision-making but are strictly intended for informational purposes. They do not constitute personalized financial advice and should not be relied upon as such. The information provided does not take into account individual investment objectives, financial circumstances, or specific needs.
General Advice Warning: The insights and recommendations offered in Pristine Gaze reports are of a general nature and are not tailored to any individual investor’s circumstances. Investment decisions are highly personal and depend on many factors, including but not limited to financial goals, risk tolerance, and current financial standing. We strongly advise consulting a qualified financial advisor who can evaluate your unique situation and provide professional guidance tailored to your needs before acting on any information contained in these reports.
Past Performance: Historical data, including past performance metrics of securities or markets mentioned in these reports, should not be regarded as an accurate indicator of future results. The financial markets are subject to significant variability, and past success does not guarantee similar outcomes in the future. It is essential to recognize that external factors, including but not limited to economic conditions, regulatory changes, and market dynamics, can greatly influence future performance and results.
Forward-Looking Statements: Certain projections and forecasts presented in Pristine Gaze reports may include forward-looking statements based on assumptions and expectations about future market conditions. These statements are speculative and inherently uncertain, as they depend on variables that may not materialize as anticipated. Factors such as economic conditions, market trends, policy changes, and unforeseen events can significantly impact these projections. Investors should approach forward-looking statements with caution and recognize the associated risks.
Data Accuracy: All financial data, metrics, and projections contained in our reports are derived from publicly available company filings, credible industry reports, and verified sources. While Pristine Gaze endeavors to ensure the accuracy, timeliness, and reliability of the information provided, we cannot guarantee its completeness or precision. Market conditions and company policies may evolve, leading to changes in the relevance of the data presented. The content of our reports may be updated or modified without prior notice.
Technical Analysis: Reports may include discussions of technical indicators, such as Relative Strength Index (RSI), Bollinger Bands, or moving averages. These indicators are tools used to analyze market trends but are inherently speculative and subject to interpretation. They do not provide definitive predictions about future price movements and should not be relied upon as sole determinants of investment decisions. Investors should combine technical analysis with other forms of research and risk assessment.
Dividend Yield: References to dividend payments or yields are based on historical data and the current financial policies of the companies discussed. Dividends are not guaranteed and may fluctuate depending on the financial performance of the company, market conditions, and regulatory requirements. Investors should consider these variables and the potential for dividend changes when evaluating dividend-paying securities.
Liability Disclaimer: Pristine Gaze, along with its directors, employees, associates, and affiliates, assumes no responsibility or liability for any losses or damages incurred due to reliance on the information or recommendations contained in our reports. This disclaimer applies to all forms of losses, including but not limited to direct, indirect, incidental, or consequential losses. Investors are hereby advised to conduct their independent research and seek professional advice before making investment decisions.
Third-Party Data and Links: some reports may reference external data, include hyperlinks to third-party websites, or incorporate information from other sources. While we aim to use credible and reliable references, Pristine Gaze does not endorse or take responsibility for the accuracy or reliability of external content. Users are advised to evaluate third-party information critically and acknowledge the risks of using such data.
Intellectual Property: All content within Pristine Gaze reports, including but not limited to text, graphics, designs, methodologies, and analyses, is the exclusive intellectual property of Pristine Gaze Pty Ltd. This content is protected under Australian and international copyright and trademark laws. Unauthorized reproduction, modification, or distribution of any part of the content without prior written consent from Pristine Gaze is strictly prohibited. Legal action may be pursued in the case of infringement.
Terms and Policies: For additional information regarding the terms and conditions of our services, our approach to data privacy, and the scope of our financial advice, please refer to our Terms and Conditions, Privacy Policy, and Financial Services Guide, which are available on our official website.