Top 4 ASX Mining Stocks with Expansion Projects
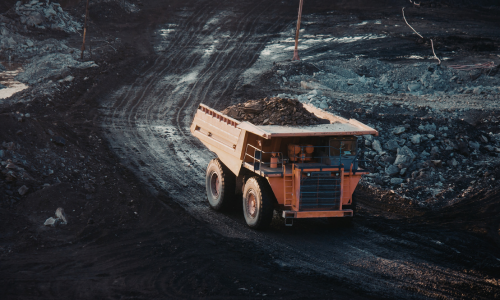
Mining companies often enter strong growth phases when they expand production capacity, develop new projects, or scale existing operations. These expansion initiatives are critical not only for increasing output but also for improving long-term revenue visibility and earnings growth. For investors analysing ASX mining growth stocks, companies with active expansion pipelines tend to offer stronger upside potential compared to those with stagnant production profiles.
In the current global environment, demand for commodities such as iron ore, copper, and lithium continues to be supported by infrastructure development, electrification trends, and renewable energy adoption. At the same time, supply constraints and underinvestment in new projects have created opportunities for companies that are actively expanding operations. This dynamic is placing greater focus on miners with growth-oriented strategies.
Expansion projects typically include new mine developments, capacity upgrades, or strategic acquisitions. These initiatives can significantly enhance production volumes and improve economies of scale. However, they also require capital investment and efficient execution, making project quality and management capability key considerations.
Within the Australian market, several mining companies stand out due to their strong expansion pipelines and growth strategies. Four ASX mining growth stocks that are well positioned include:
- BHP Group Ltd (ASX: BHP)
- Rio Tinto Ltd (ASX: RIO)
- South32 Ltd (ASX: S32)
- Pilbara Minerals Ltd (ASX: PLS)
Each of these companies is actively investing in expansion projects to drive future growth.
Why Expansion Projects Matter in Mining Stocks
Expansion is a key driver of long-term value in mining companies. Without growth in production, earnings remain dependent solely on commodity prices.
Key characteristics of ASX mining growth stocks include:
- Active development of new projects
- Increasing production capacity
- Exposure to high-demand commodities
- Long-term growth visibility
- Strong capital investment plans
Companies with these traits are often better positioned for sustained growth.
BHP Group Ltd (ASX: BHP)
BHP is one of the world’s largest mining companies and continues to invest heavily in expansion, particularly in copper and future-facing commodities. Copper is expected to play a key role in electrification, making BHP’s expansion strategy highly relevant.
Among ASX mining growth stocks, BHP offers a combination of scale and long-term expansion potential.
The company benefits from:
- Expansion in copper projects
- Diversified commodity exposure
- Strong capital investment capability
- Long-life asset base
Its focus on future-facing resources supports long-term growth.
Rio Tinto Ltd (ASX: RIO)
Rio Tinto continues to invest in expanding its iron ore operations while also increasing exposure to energy transition metals such as lithium and copper.
Within ASX mining growth stocks, Rio combines stable production with expansion initiatives.
The company benefits from:
- Expansion of iron ore operations
- Investment in lithium and copper projects
- Strong operational efficiency
- High-quality asset base
These initiatives support both stability and growth.
South32 Ltd (ASX: S32)
South32 is a diversified miner focusing on base metals such as aluminium, manganese, and copper, with increasing emphasis on future-facing commodities.
Among mid-cap ASX mining growth stocks, South32 offers expansion-driven upside.
The company benefits from:
- Investment in base metal projects
- Exposure to energy transition metals
- Growth through project development
- Diversified portfolio
Its focus on strategic commodities enhances its growth outlook.
Pilbara Minerals Ltd (ASX: PLS)
Pilbara Minerals is actively expanding its Pilgangoora lithium project to increase production capacity and meet rising demand.
Within lithium-focused ASX mining growth stocks, Pilbara stands out for its aggressive expansion strategy.
The company benefits from:
- Expansion of lithium production capacity
- Strong exposure to EV demand
- Increasing operational scale
- High market interest
Lithium demand continues to support its growth trajectory.
Comparing the Four Mining Growth Stocks
Although all four companies are expanding, their strategies differ.
BHP:
- Large-scale diversified expansion
Rio Tinto:
- Balanced growth with stability
South32:
- Mid-cap expansion in base metals
Pilbara Minerals:
- Lithium-focused production growth
These differences provide varied exposure to mining growth opportunities.
Key Drivers Behind Mining Expansion
Several factors support expansion in ASX mining growth stocks.
Important drivers include:
- Rising global demand for commodities
- Electrification and renewable energy trends
- Supply constraints
- Strong commodity pricing
- Strategic investments in future metals
Risk Considerations
Despite strong growth potential, ASX mining growth stocks remain exposed to certain risks.
Potential risks include:
- Project delays or cost overruns
- Commodity price volatility
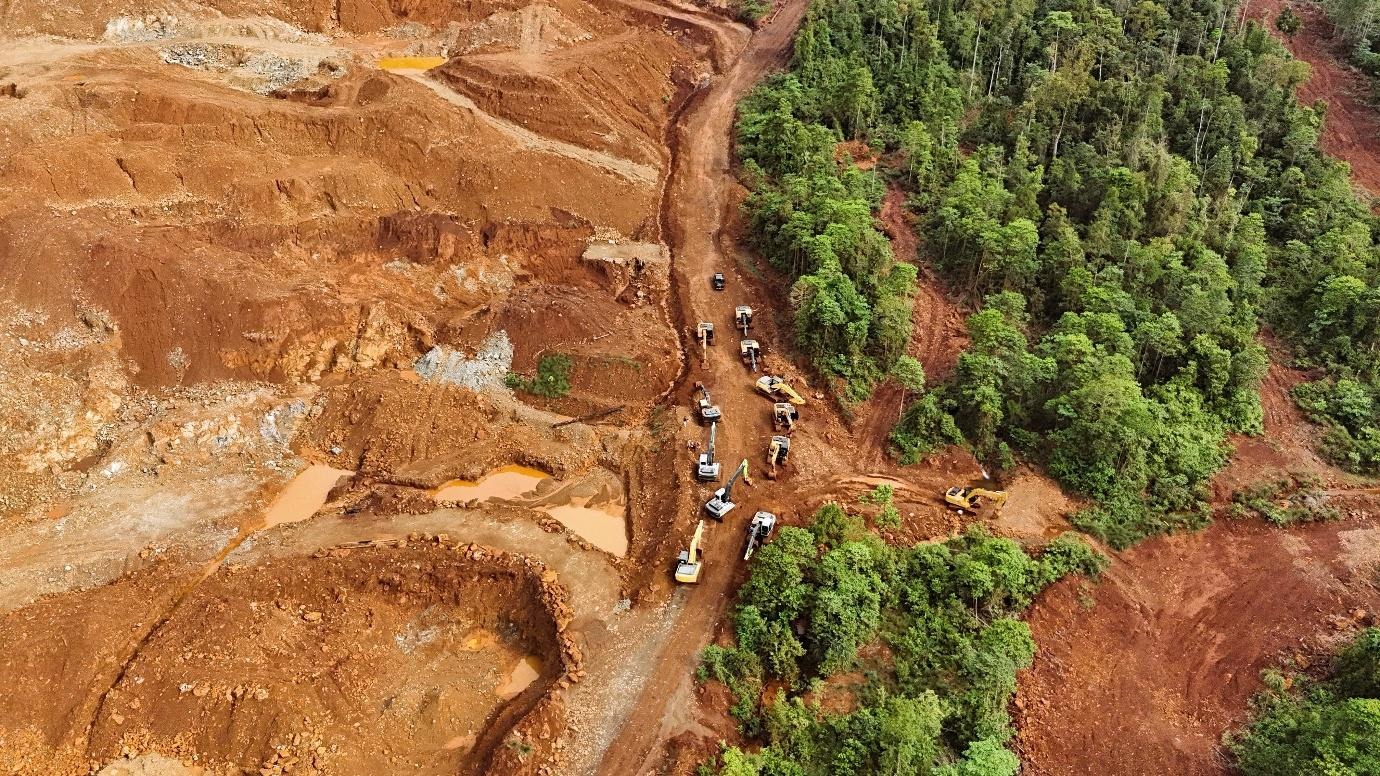
- Regulatory and environmental challenges
- Capital expenditure risks
- Global economic slowdown
Disclaimer:
General Financial Product Advice and Regulatory Framework: Pristine Gaze Pty Ltd (ABN 66 680 815 678, ACN 680 815 678) operates as Corporate Authorised Representative (CAR No. 001312049) of Alpha Securities Pty Ltd (AFSL 330757), which is licensed and regulated by the Australian Securities and Investments Commission under the Corporations Act 2001 (Cth). This report contains general financial product advice only and has been prepared without consideration of your personal objectives, financial situation, specific needs, circumstances, or investment experience. The information is not tailored to individual circumstances and may not be suitable for your particular situation. Before acting on any information contained herein, you should carefully consider its appropriateness having regard to your personal objectives, financial situation, and needs, and consider seeking personal financial advice from a qualified financial adviser who can assess your individual circumstances and provide tailored recommendations.
Investment Risks and Market Warnings: All investments carry significant risk, and different investment strategies may carry varying levels of risk exposure including total loss of invested capital. The value of investments and income derived from them can fluctuate significantly due to market conditions, economic factors, company-specific events, regulatory changes, commodity price volatility, currency fluctuations, interest rate movements, and other factors beyond our control. Securities markets are subject to market risk from general economic conditions and investor sentiment, liquidity risk affecting the ability to buy or sell securities at desired prices, credit risk from issuer default or deterioration, operational risk from inadequate internal processes, sector-specific risks including industry regulatory changes, technology obsolescence, management changes, competitive pressures, supply chain disruptions, and mining-specific risks including resource estimation uncertainty, operational hazards, environmental compliance, permitting delays, commodity price cycles, geopolitical factors affecting mining operations, and exploration risks. Small-cap and speculative mining stocks carry additional risks including limited liquidity, higher volatility, dependence on key personnel, limited operating history, uncertain cash flows, and potential failure to achieve commercial production.
Information Accuracy and Limitations: While we endeavour to ensure information accuracy and reliability, we make no representations or warranties (express or implied) regarding the accuracy, reliability, completeness, timeliness, or suitability of information provided, except where liability cannot be excluded under applicable law. This report may include information from third-party sources including company announcements, regulatory filings, research reports, market data providers, financial news services, and publicly available information, which we do not independently verify and for which we assume no responsibility. Past performance, examples, historical data, or projections are not indicative of future results, and no guarantee of future returns is provided or implied. To the maximum extent permitted by law, Pristine Gaze Pty Ltd and Alpha Securities Pty Ltd, together with their respective directors, officers, employees, representatives, and related entities, exclude all liability for any errors, omissions, inaccuracies, loss or damage (including direct, indirect, consequential, or special damages) arising from reliance on information provided, investment decisions made based on this report, market losses, opportunity costs, and technical issues or system failures.