Free Sample Report – Trajan Group Holdings Ltd.
Trajan Group Holdings Ltd. engages in the development and manufacture of analytical and life sciences products and devices, seeking to enrich human well-being through scientific measurement. It operates through Analytical Products and Life Science Solutions segments. The Analytical Products segment designs, manufactures, distributes, and sells Analytical components and consumables. The Life Science Solutions segment is involved in the sale of pathology, automation workflow solutions, micro sampling devices, testing, and data analysis. The company was founded by Stephen Andrew Tomisich and Angela Tomisich on August 11, 2011 and is headquartered in Ringwood, Australia.
Stock Performance Profile:
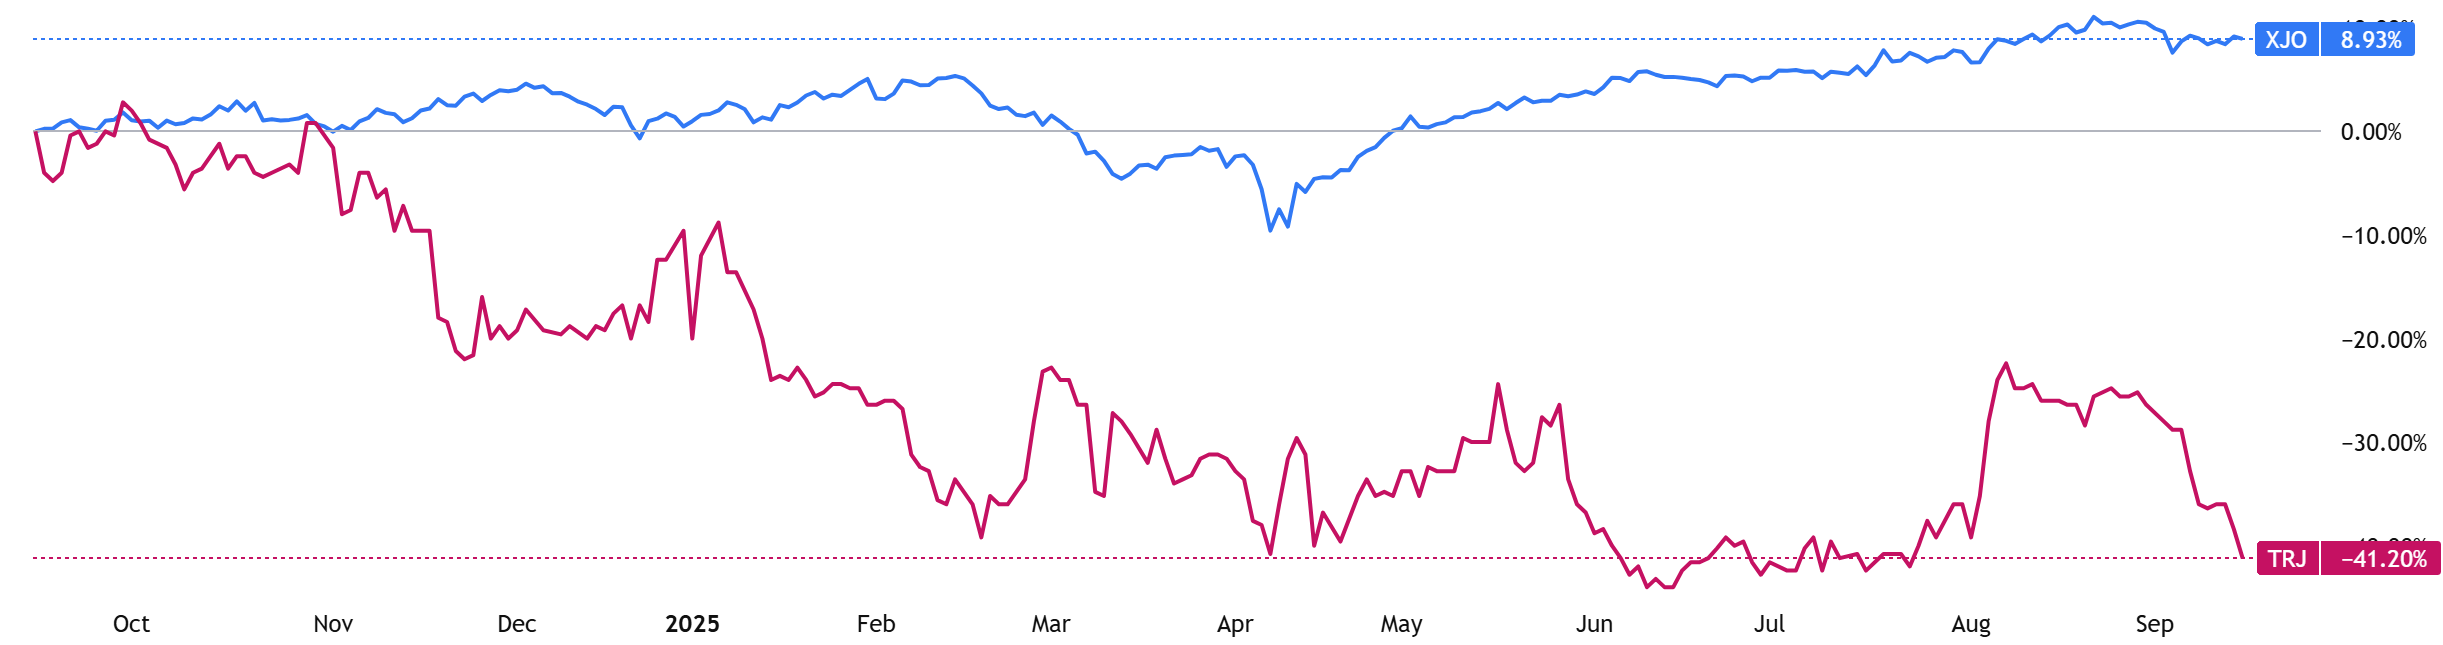
(Source: TradingView) One-Year Performance Profile of TRJ compared to ASX200 (XJO).
From the Company Reports:
FY25 Highlights:
Trajan delivered record FY25 revenue of $166.46 million, marking 7.38% year-on-year growth despite a $3.9 million impact from its discontinued biotech syringe line. nEBITDA rose sharply—26.6%—to $15.5 million, even with foreign exchange headwinds and delayed microsampling shipments. Cash and equivalents increased to $11.85 million, while net debt was reduced to $29.6 million, bringing leverage down to ~1.9×.
The company’s global footprint spans seven manufacturing sites, supporting diversified operations in consumables, capital equipment, and disruptive technologies. TRJ also guided toward continued margin expansion and steady advancement of its disruptive product lines, building momentum for FY26.
Historical Financial Snapshot:
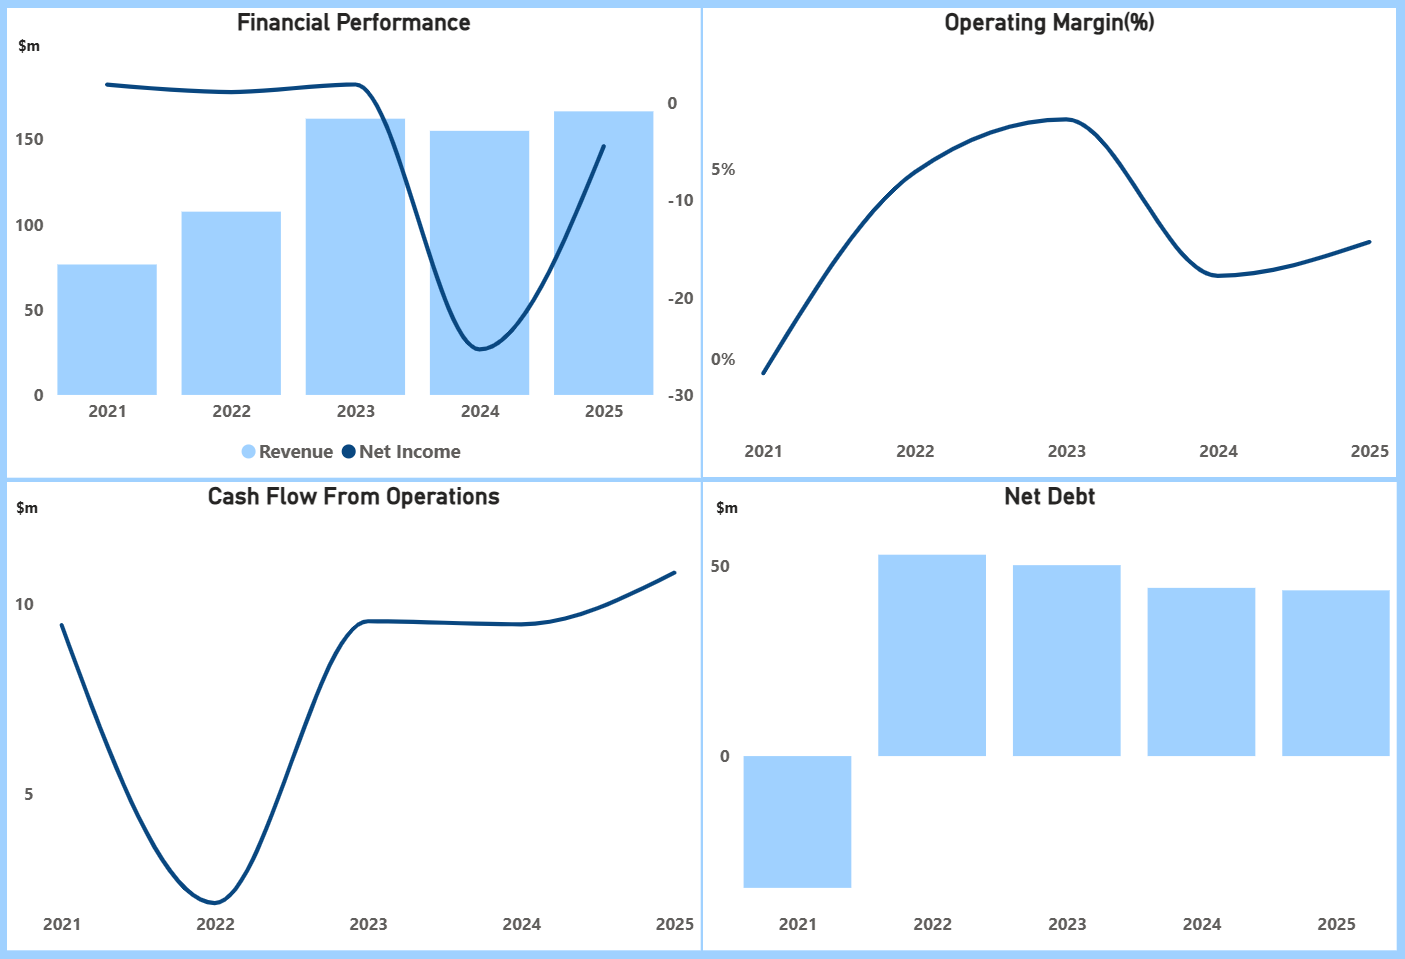
(Graphic Source: Pristine Gaze)
Tarjan demonstrated steady recovery, with:
1. Financial Performance: Revenue grew steadily from $76.57 million in 2021 to $166.46 million in 2025, showing resilience despite headwinds. Net profit swung from small gains in 2021–23 to a sharp loss of $25 miliion in FY24, before narrowing to a $4 million loss in FY25 as restructuring and portfolio adjustments began to stabilise operations.
2. Operating Margin: Margins improved from negative in 2021 to a peak of 6.3% in FY23, before compressing to 2.2% in 2024 due to one-off impacts. 2025 saw partial recovery to 3.1%, reflecting early benefits from cost control and product mix optimisation.
3. Cash Flow from Operations: Operating cash flow rebounded strongly from just $2.1 million in 2022 to $10.8 million in 2025, highlighting improved working capital discipline and stronger earnings quality despite reported losses.
4. Net Debt: Debt increased to $53 million in 2022 with expansion initiatives, but moderated to $44 million in 2024–25. Management maintained leverage discipline, keeping net debt stable while reinvesting in innovation and global manufacturing capabilities.
Growth:
Trajan’s growth is coming from multiple balanced sources. The Components & Consumables segment is expanding, with several core product lines growing 15-20% year-on-year, supported by resilient demand even where individual product lines dropped out.
Capital Equipment sees renewed momentum, especially in pharmaceutical, clinical, and environmental workflows, and order books are strengthening. Its Disruptive Technologies segment, including microsampling and Versiti, is making strides toward break-even supported by commercial activation.
Margin gains are being driven through strategic pricing, product mix refinement, and increased scale. Broad global reach and diversified segment exposure amplify growth opportunities.
Outlook:
Trajan is advancing key innovation projects and product launches to sharpen its competitive edge. The company is pushing forward its Versiti platform, with field-evaluation units deploying to pharmaceutical customers in 2025, targeting onsite quality measurement in bioreactors.
Concurrently, microsampling is on track to reach breakeven this financial year, boosted by a growing backlog and repeat orders. New product capabilities are also being introduced, including modular GC consumables, advanced glass technologies, and instrument software for regulatory-ready chromatography (21 CFR Part 11).
With maintained guidance for $160–165 million net revenue and $17–19 million normalised EBITDA, these projects offer clear levers for growth beyond cost management and core operations.
Risk Analysis:
Trajan faces risks from execution across its global manufacturing footprint, where supply chain disruptions or delays in product shipments could impact delivery schedules and revenue timing. Currency fluctuations remain a headwind given its international operations. The winding down of legacy product lines, while strategic, carries short-term earnings pressure and execution risk in transitioning to higher-growth segments. Competitive intensity in consumables and capital equipment may affect pricing power. Additionally, debt management and maintaining leverage discipline are essential to support future expansion.
Technical Analysis:
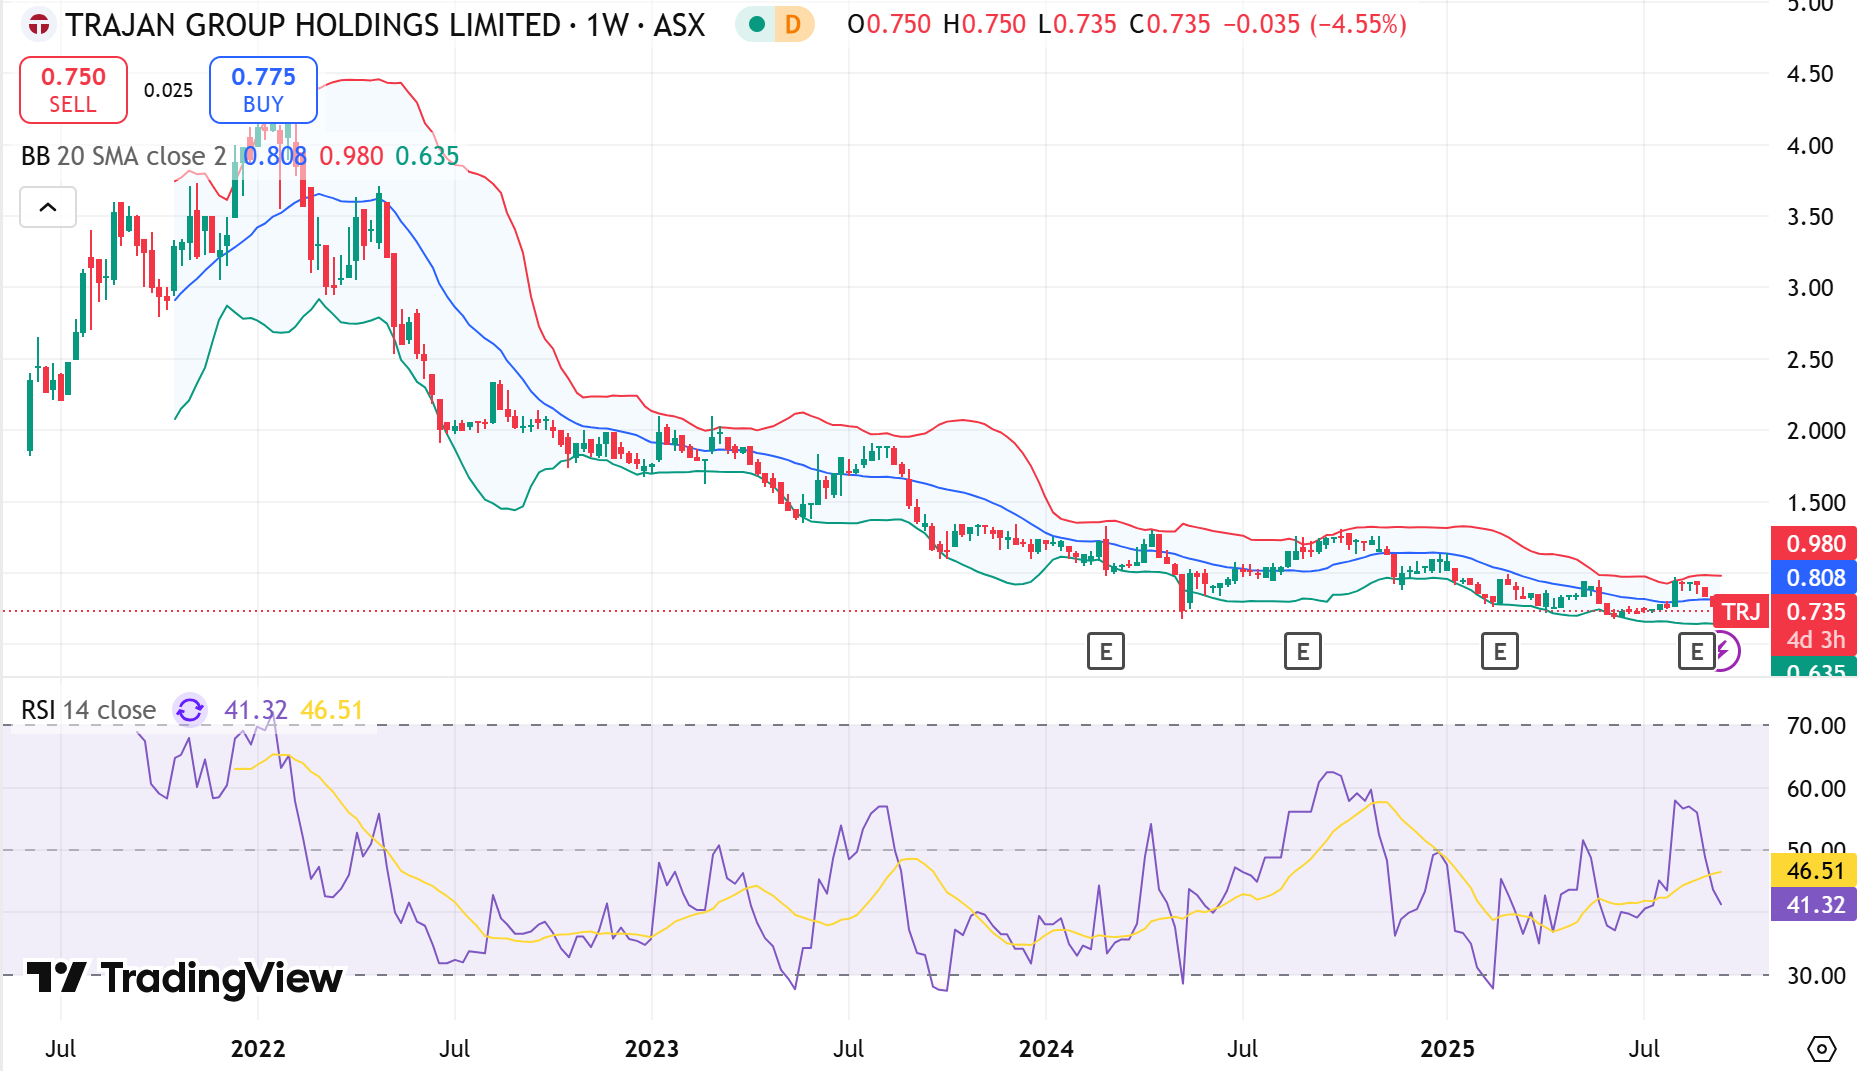
(Graphic Source: TradingView) Trajan Group Holdings Limited (ASX: TRJ) Weekly Time-Frame (WTF) Chart.
Trajan Group Holdings’ weekly chart shows the stock consolidating after a prolonged downtrend, with recent price action holding above key support near $0.63. The Bollinger Bands are narrowing, suggesting reduced volatility and the potential for a breakout. RSI at 41.32 indicates the stock is approaching oversold levels, which often attract bargain hunters. A move above the mid-band resistance at $0.808 would strengthen recovery signals. Overall, technicals suggest stabilisation, with room for gradual upside if momentum improves and buying pressure builds.
Analyst’s Take:
Trajan Group Holdings offers investors exposure to a global life sciences business with a growing presence across consumables, capital equipment, and disruptive technologies. The company has expanded its customer base across pharmaceutical, clinical, and environmental sectors, with order books strengthening and several product lines achieving double-digit growth. Projects such as the Versiti platform and microsampling solutions are advancing toward broader adoption, supported by regulatory-ready technologies that enhance laboratory compliance. Management has streamlined operations, reduced leverage, and aligned debt to long-term growth, creating balance sheet flexibility. With its diversified portfolio, expanding innovation pipeline, and proven ability to scale globally, Trajan is positioned to capture growth opportunities in high-value healthcare and analytical markets. This blend of innovation and operational discipline makes it a compelling option for investors seeking both resilience and growth.
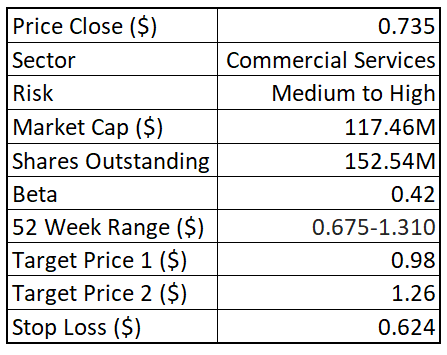
As per Pristine Gaze, you may consider a “Buy” on “Trajan Group Holdings Limited” at the closing price of “$0.735” (As of 15 September 2025).
*All currency figures are in Australian Dollars unless stated otherwise.
*All data sourced from company reports and TradingView.
Disclaimer
The reports provided by Pristine Gaze are designed to deliver general financial insights, including stock and sector market analysis and investment commentary. These reports aim to support informed decision-making but are strictly intended for informational purposes. They do not constitute personalized financial advice and should not be relied upon as such. The information provided does not take into account individual investment objectives, financial circumstances, or specific needs.
General Advice Warning: The insights and recommendations offered in Pristine Gaze reports are of a general nature and are not tailored to any individual investor’s circumstances. Investment decisions are highly personal and depend on many factors, including but not limited to financial goals, risk tolerance, and current financial standing. We strongly advise consulting a qualified financial advisor who can evaluate your unique situation and provide professional guidance tailored to your needs before acting on any information contained in these reports.
Past Performance: Historical data, including past performance metrics of securities or markets mentioned in these reports, should not be regarded as an accurate indicator of future results. The financial markets are subject to significant variability, and past success does not guarantee similar outcomes in the future. It is essential to recognize that external factors, including but not limited to economic conditions, regulatory changes, and market dynamics, can greatly influence future performance and results.
Forward-Looking Statements: Certain projections and forecasts presented in Pristine Gaze reports may include forward-looking statements based on assumptions and expectations about future market conditions. These statements are speculative and inherently uncertain, as they depend on variables that may not materialize as anticipated. Factors such as economic conditions, market trends, policy changes, and unforeseen events can significantly impact these projections. Investors should approach forward-looking statements with caution and recognize the associated risks.
Data Accuracy: All financial data, metrics, and projections contained in our reports are derived from publicly available company filings, credible industry reports, and verified sources. While Pristine Gaze endeavors to ensure the accuracy, timeliness, and reliability of the information provided, we cannot guarantee its completeness or precision. Market conditions and company policies may evolve, leading to changes in the relevance of the data presented. The content of our reports may be updated or modified without prior notice.
Technical Analysis: Reports may include discussions of technical indicators, such as Relative Strength Index (RSI), Bollinger Bands, or moving averages. These indicators are tools used to analyze market trends but are inherently speculative and subject to interpretation. They do not provide definitive predictions about future price movements and should not be relied upon as sole determinants of investment decisions. Investors should combine technical analysis with other forms of research and risk assessment.
Dividend Yield: References to dividend payments or yields are based on historical data and the current financial policies of the companies discussed. Dividends are not guaranteed and may fluctuate depending on the financial performance of the company, market conditions, and regulatory requirements. Investors should consider these variables and the potential for dividend changes when evaluating dividend-paying securities.
Liability Disclaimer: Pristine Gaze, along with its directors, employees, associates, and affiliates, assumes no responsibility or liability for any losses or damages incurred due to reliance on the information or recommendations contained in our reports. This disclaimer applies to all forms of losses, including but not limited to direct, indirect, incidental, or consequential losses. Investors are hereby advised to conduct their independent research and seek professional advice before making investment decisions.
Third-Party Data and Links: some reports may reference external data, include hyperlinks to third-party websites, or incorporate information from other sources. While we aim to use credible and reliable references, Pristine Gaze does not endorse or take responsibility for the accuracy or reliability of external content. Users are advised to evaluate third-party information critically and acknowledge the risks of using such data.
Intellectual Property: All content within Pristine Gaze reports, including but not limited to text, graphics, designs, methodologies, and analyses, is the exclusive intellectual property of Pristine Gaze Pty Ltd. This content is protected under Australian and international copyright and trademark laws. Unauthorized reproduction, modification, or distribution of any part of the content without prior written consent from Pristine Gaze is strictly prohibited. Legal action may be pursued in the case of infringement.
Terms and Policies: For additional information regarding the terms and conditions of our services, our approach to data privacy, and the scope of our financial advice, please refer to our Terms and Conditions, Privacy Policy, and Financial Services Guide, which are available on our official website.